


Measuring protein concentration is something that always pops up – purifying proteins, doing biological studies, routine monitoring of lab samples. The concentration of this can be found by measuring how much ultraviolet light the sample absorbs at a certain wavelength. This can be done using a UV-Vis spectrophotometer. That stated, what you really obtain depends a lot on the method you use, and the sample you are dealing with.
For laboratories looking for a spectrophotometer for protein concentration, the first step is to determine whether the sample is suitable for direct UV absorbance. If the sample composition is complex, or if there is obvious absorbance interference, other protein quantification methods may be needed.
How Does UV-Vis Spectrophotometer Measure Protein Concentration?
Protein Absorbance at 280 nm
Tryptophan and tyrosine—aromatic residues inside proteins—absorb UV light. That’s the basic reason why reading absorbance around 280 nm (A280) has become such a standard approach for estimating protein concentration.
But A280 is not some universal solution. Different proteins have different amino acid compositions, so their UV absorption varies. You can’t just apply one conversion factor to every protein and expect an accurate number.
How Is Absorbance Converted into Concentration?
Under applicable measurement conditions, absorbance can be converted into concentration using the Beer-Lambert Law:
A = ε × c × l
Where A is absorbance, ϵ is the extinction coefficient, c is concentration, and l is path length.
For a known purified protein, concentration can be calculated based on its extinction coefficient and the actual path length. If the protein’s extinction coefficient is unknown, suitable parameters must first be determined, or another quantification method should be chosen.
Understanding how a UV-Vis spectrophotometer works helps explain the principles of absorbance measurement and why factors such as path length affect the final result.
Which Method Should You Use for Protein Quantification?
A280 works for some samples, but it’s not a one-size-fits-all answer. Before you settle on a method, look at what’s in the sample: its composition, its purity, and whether the buffer or other ingredients might interfere.
Direct UV Absorbance at 280 nm
If the sample is a highly purified protein with known absorption characteristics, direct A280 measurement is usually a practical choice.
Its advantages are relatively simple operation and no need for additional colorimetric reactions. After measurement, concentration can be calculated using the protein’s extinction coefficient and path length.
However, nucleic acids and other UV-absorbing substances may interfere with the result. If the sample contains a large amount of these components, the directly measured absorbance may not come entirely from protein. Therefore, a single A280 value cannot be used alone to determine the protein concentration in a sample.
Bradford, BCA, and Lowry Assays
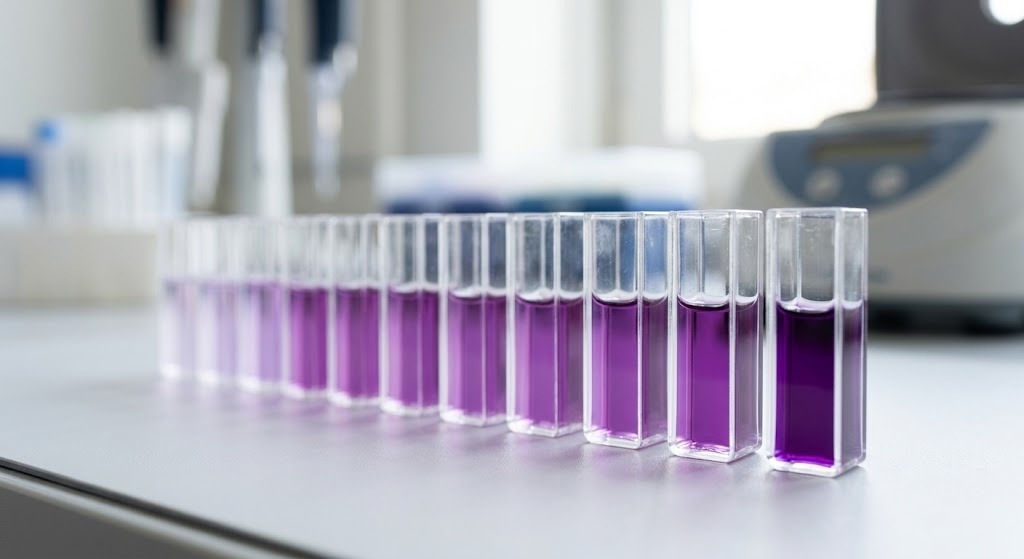
For samples with complex composition, unknown protein types, or unsuitability for direct A280, colorimetric quantification methods such as Bradford, BCA, or Lowry can be considered.
These methods quantify based on the color change produced by the reaction between protein and reagents. They usually require a standard curve prepared with known concentrations, and then the sample concentration is calculated from the measured result.
The three methods are not completely identical in their applicable conditions. For example, the Bradford assay may be interfered with by certain detergents; the BCA assay requires attention to reducing agents and other components that may affect the reaction. Therefore, when selecting a method, consider both the sample matrix and the reagents used in the experiment.
The Harvard Medical School Macromolecular Interactions Center’s protein concentration measurement reference compares the features and limitations of direct UV absorbance, BCA, Bradford, and other methods, and can serve as a reference when choosing a measurement method.
What Affects Protein Concentration Measurement Accuracy?
If the measured protein concentration does not match expectations, it does not necessarily mean the instrument is faulty. Sample composition, blank setup, path length, and measurement range can all affect the final result.
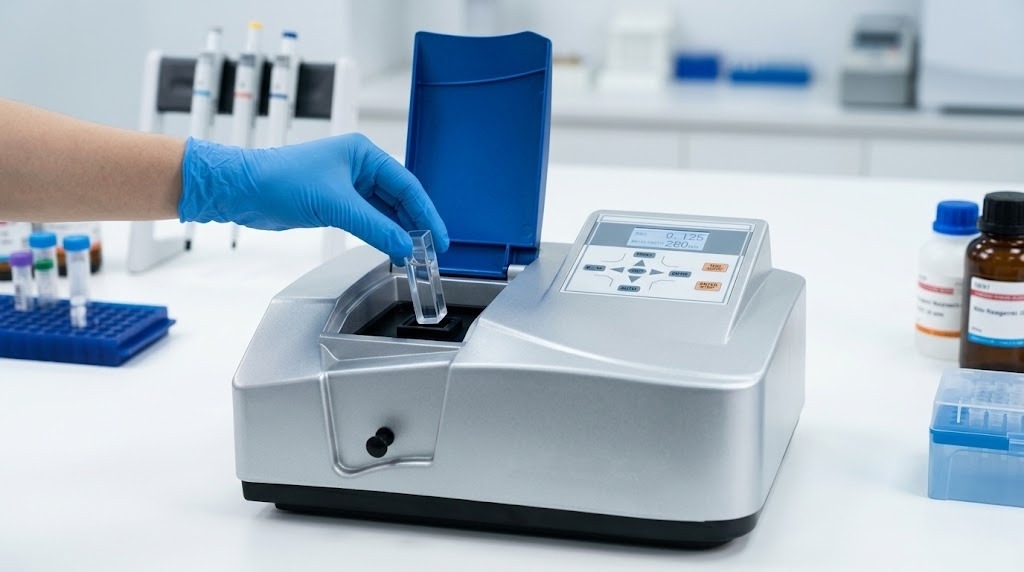
Sample Composition and Buffer Interference
Nucleic acids and other UV-absorbing substances in the sample may affect the A280 reading. If the buffer itself has significant absorbance near the target wavelength, it may also cause measurement deviation.
Before measurement, calibrate with a blank that matches the sample buffer system. If sample background interference is strong, consider changing to a suitable buffer system or switching to a quantification method more compatible with the sample.
Wavelength and Measurement Range
The measurement wavelength should match the method used. The A280 method requires an instrument that supports the appropriate UV wavelength; for colorimetric methods such as Bradford, BCA, and Lowry, the measurement wavelength should be selected according to the specific reagent system.
In addition, sample absorbance needs to be within the measurement range applicable to the instrument and method. Reading too high? Dilute the sample as your protocol allows, measure again, and multiply back by the dilution factor. Reading too low? Check whether the sample is simply too dilute for that method’s detection limit.
When selecting an instrument, in addition to confirming the wavelength range, also consider wavelength range and spectral bandwidth to ensure the relevant parameters are suitable for the analytical method planned.
Optical Path Length and Sample Handling
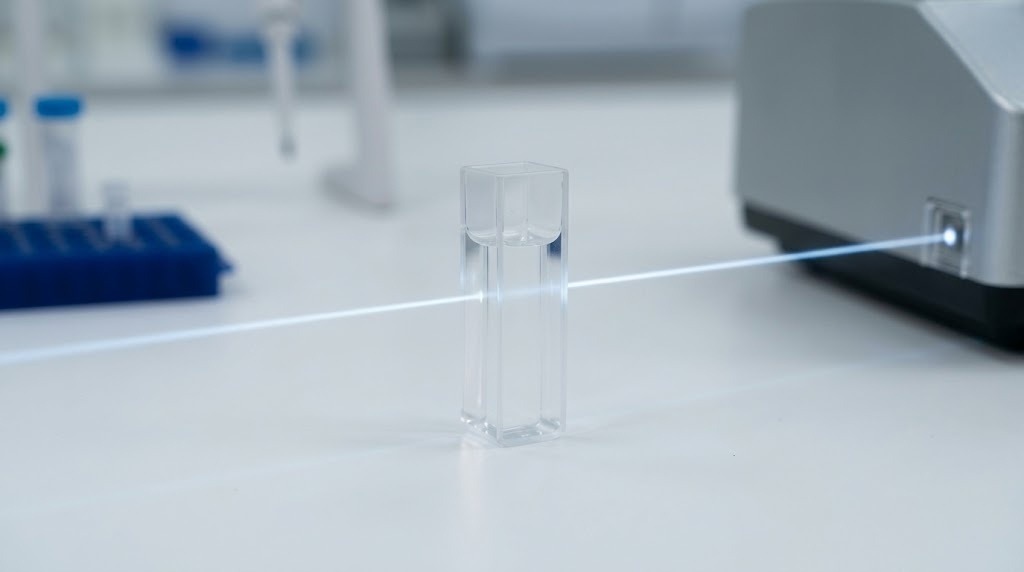
Path length matters since absorbance is dependent on it. If the light goes through different path lengths, the absorbance values of two samples with the same concentration may vary. So when you do your concentration calculation be sure to utilize the path length that is appropriate for the particular setup you measured with.
Clean the right areas before you begin. If anything seems out of place run the blank and the samples under the same conditions and repeat the measurements. Refer to the directions in the instrument manual.
If results keep drifting, don’t immediately blame the instrument. Check the blank, sample background, path length, and measurement range first. Then decide whether the method itself needs adjusting.
How to Choose a Spectrophotometer for Protein Analysis
When choosing a spectrophotometer for protein concentration analysis, the real questions are: Which quantification method will you use? How much sample do you have? And can the instrument support the measurement conditions that method requires?
With A280, go with a UV-Vis spectrophotometer that can measure absorbance at 280 nm. But don’t end there. Consider the protein itself, the kind and purity as UV absorption is not the same for all proteins and impurities such as nucleic acids can easily skew the reading. If the sample is excessively concentrated for the equipment or method, it may be necessary to dilute the sample according to the experimental needs.
For the Bradford, BCA or Lowry procedures, choose the suitable measurement wavelength according to the reagents employed, and ensure that the instrument can meet the measurement and quantification requirements of the method. Do not assume that an instrument is suitable for all protein quantification workflows simply because it supports UV-Vis measurement.
Sample volume is another important factor. For experiments with sufficient sample volume and conventional cuvette measurement, a regular UV-Vis spectrophotometer can be considered. If the sample is precious and the available volume is very small, a microvolume nano spectrophotometer can be considered; such instruments are more suitable for micro-volume sample measurement needs.
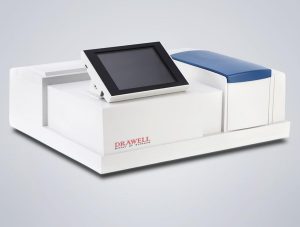
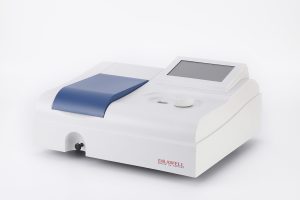
Drawell offers regular UV-Vis spectrophotometers and microvolume nano spectrophotometers. When you’re choosing between them, start with the quantification method and sample volume, then check the wavelength range, measurement performance, and analytical functions of the specific model. Don’t choose based only on the instrument category.
Final Thoughts
When determining protein concentration using a UV-Vis spectrophotometer, the most important consideration is the method-sample fit. A280 is usually the more direct route. If the protein is pure and the absorbance behavior is understood . In this case, the determination is easier if the sample is complicated or subject to interference, using procedures such as Bradford, BCA or Lowry.
If the outcome is not what you want, check the backdrop, blank, path length, and measurement range before you declare the instrument faulty. Once you establish your method and sample criteria, pick a spectrophotometer that meets the wavelength, sample volume and measurement capabilities you require. That makes measuring protein concentration more reliable – and more useful for the investigation you’re really doing.
Get Quote Here!
Latest Posts

What Next?
For more information, or to arrange an equipment demonstration, please visit our dedicated Product Homepage or contact one of our Product Managers.


