


AAS calibration is the process of establishing and verifying the relationship between analytical signal and analyte concentration, while an AAS calibration curve is used to quantify unknown samples within the applicable working range. A well controlled calibration process is essential for obtaining reliable quantitative results. Problems during calibration can affect the accuracy and comparability of subsequent sample measurements.
Building a reliable AAS calibration curve is not just about injecting a few standard solutions into the instrument and letting the software draw a line. Before you start measuring, things like source alignment, light signal conversion, and atomization efficiency in how an atomic absorption spectrometer works all shape how stable the final calibration response will be.
In real lab work, we do not just measure instrument response. We also need to evaluate calibration curve quality and confirm that unknown sample responses actually fall inside the valid working range. Atomic absorption is widely used in food, environmental, metallurgical, and pharmaceutical elemental analysis. Following a proper AAS calibration workflow is a core requirement for data that meets quality control (QC) expectations.
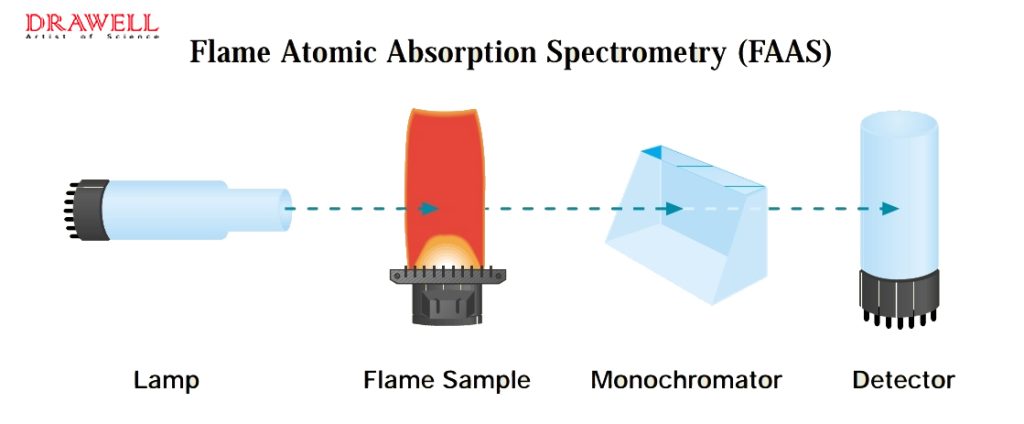
What Does AAS Calibration Check?
In daily lab talk, many people mix up “calibration” and “calibration curve.” But they sit at different levels.
AAS Calibration: this is the complete workflow. It starts with instrument initialization and warm-up, spectral line selection, and baseline zeroing. Then it moves through standard series measurement, curve response evaluation, and later sample verification.
AAS Calibration Curve: this is the mathematical and physical quantitative relationship built by measuring a series of known-concentration standards and plotting their absorbance response against concentration.
In short, the AAS calibration curve is the core output of the whole calibration workflow. But calibration itself includes broader hardware checks and quality verification steps.
What Affects AAS Calibration?
To get a smooth curve with good reproducibility, you have to control lab conditions and hardware variables. These factors can directly disturb the AAS calibration response signal:
- Element lamp and wavelength settings: hollow cathode lamp (HCL) emission intensity, warm-up stability, and monochromator slit width.
- Atomization conditions: fuel and oxidant gas flow ratio, burner height, or the graphite furnace temperature program.
- Blank and background signal: purity of the reagent blank and non-specific absorption from sample matrix.
- Standard solution quality: volume errors during standard dilution, acid matching, and contamination control.
- Instrument drift and environmental fluctuation: Instrument drift, temperature changes, and fluctuations in the analytical signal.
Flame and graphite furnace AAS use different atomization conditions, so their calibration workflows and operating parameters should be selected according to the instrument configuration and analytical method. In practice, because flame and graphite furnace AAS use different atomization mechanisms, their operating parameters and settings also have different priorities.
Prepare the AAS Before Calibration
Before you build the AAS calibration curve, good preparation is the best way to avoid calibration failure and save standard solutions.
Check the Instrument
Follow the manufacturer’s general operating procedure and the specific analytical method standard for these physical checks:
Power-on initialization and warm-up: start the instrument software and let the optical system and electronics reach thermal balance. This helps avoid baseline drift during measurement.
Light source status and alignment: check that the hollow cathode lamp for the target element is firmly installed and that the light spot passes accurately through the center absorption zone of the atomizer.
Gas path and burner check: check that fuel gas pressure is stable, clean the burner slot, remove carbon deposits or salt buildup, and make sure the flame is uniform.
Exhaust and safety system: confirm the lab exhaust system is working and that safety interlocks and gas leak detection are in good condition.
At this stage, do not blindly copy fixed parameter settings. Adjust flexibly based on the actual instrument model and the physical properties of the element being measured.
Prepare Standards and Samples
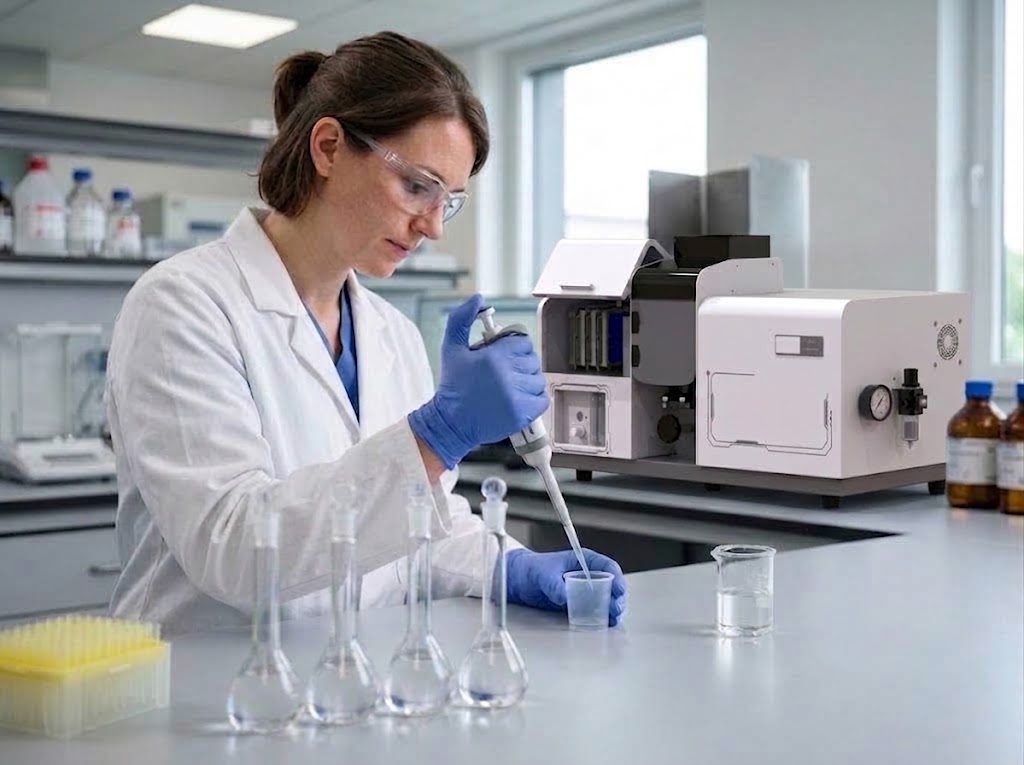
The quality of standard and sample preparation directly sets the ceiling for AAS calibration:
Choose a reasonable concentration gradient: The calibration standards should bracket the expected sample concentration while remaining within the applicable calibration range defined by the analytical method.
Matrix Matching: The standards and samples should use the same acid composition and concentration where required by the analytical method, to eliminate viscosity, surface tension, and ionization interference.
Contamination control: Use appropriately cleaned laboratory ware and validated preparation procedures to minimize contamination.
Sample prep confirmation: when measuring complex matrices, if you do not strictly follow the digestion or preparation rules required by sample preparation for AAS analysis, leftover organics and suspended particles can strongly interfere with linear reproducibility of the absorption signal.
How to Calibrate an AAS: 7 Steps
Here is the standard 7-step method for building a reliable AAS calibration curve.
Step 1. Select the Element and Set the Lamp
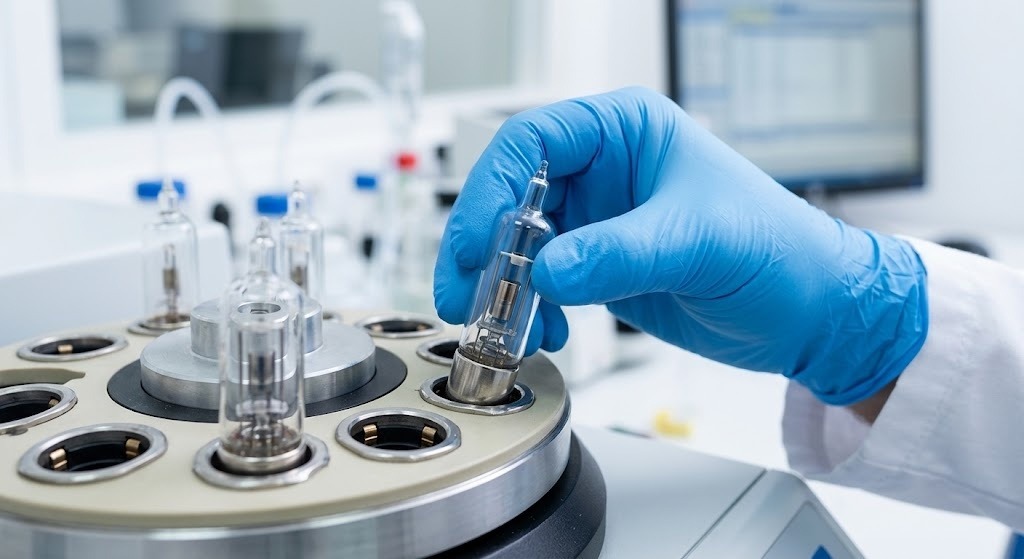
First, select the target element in the operating software and install the matching hollow cathode lamp (HCL). Adjust the lamp current to the recommended working range and adjust lamp position for maximum energy output. Set the analytical wavelength and slit width according to the target element, instrument configuration, and analytical method.
Step 2. Set the Atomization Conditions
Different sample types and target elements usually match depend on the specific AAS analytical methods selected for your application.This means the analyst needs to choose the most suitable atomization mode based on the detection need:
Flame AAS: adjust the oxidant-fuel ratio and burner position to maximize sample nebulization efficiency. This suits routine concentration elemental analysis.
Graphite Furnace AAS: Graphite Furnace AAS can provide higher sensitivity for trace- level determinations, depending on the analyte and method. Set the four-stage temperature program for drying, ashing, atomization, and cleanup, and optimize protective gas flow.
Hydride Generation: Hydride generation can be used for elements that form suitable volatile hydrides, depending on the instrument and analytical method.
Step 3. Run the Blank
Introduce the prepared reagent blank into the atomizer. Click “Auto Zero” or “Blank” in the software to set the measurement baseline for the light signal.
The blank solution removes background signal from solvent, acid, and environment. If the absorbance reading is unusually high or fluctuates sharply when running the blank, stop calibration. Check for reagent contamination or a blocked sample introduction system.
Step 4. Measure the Standards
Start measuring the standard solution series. This is the most critical data collection stage for generating the AAS calibration curve:
Measurement order: A common workflow is to begin with the blank and proceed from lower to higher concentration standards, following the analytical method and instrument instructions.
Replicate measurements: Replicate measurements may be used when required to assess repeatability and reduce the effect of random variation.
Number and concentration of standards: The number and concentration levels of standards should follow the analytical method and the instrument’s calibration requirements.
Step 5. Build the AAS Calibration Curve
Once absorbance data for all standard points is collected, the analysis software plots the data on a coordinate system. The X-axis is standard concentration. The Y-axis is the corresponding absorbance response.
The software automatically calculates and fits the AAS calibration curve. Depending on the method and concentration range, linear, weighted, or nonlinear fitting may be appropriate when supported by the instrument software and analytical procedure.
Step 6. Check Linearity and Curve Quality
After curve fitting, do not just use it blindly. You must evaluate the internal quality of the curve.
AAS calibration quality evaluation should not rely only on whether it “looks like a straight line” or on a single statistical number.
An RSC study on AAS calibration highlights the importance of considering curve-fitting error, instrumental drift, outlying standards, and errors in working standards when evaluating calibration performance (Refer to RSC Analytical Methods Committee, Calibration in Atomic Absorption Spectrometry).
In practice, after fitting, analysts should focus on:
- Whether the response slope is normal within the set range.
- Whether residuals and fitting deviations for each standard point are evenly distributed.
- Whether there is an outlying standard point caused by pipetting error or operation mistake.
Step 7. Verify the Curve and Measure Unknown Samples
Before measuring actual samples, you must perform calibration verification:
Run QC check standards: Run an independent calibration verification or QC standard when required by the analytical method, and confirm that the result meets the method-defined acceptance criteria.
Measure unknown samples: after verification passes, measure unknown samples in sequence and record absorbance values.
Range check: confirm that all calculated sample concentrations fall within the actual valid range of the calibration curve.
Special reminder: never automatically extrapolate sample readings above the highest calibration curve concentration. For samples that are too high, dilute proportionally, re-measure, and multiply by the dilution factor in the final calculation formula.
What Makes an AAS Calibration Curve Reliable?
After completing the 7 steps and checking the initial fit, we need to answer from a quality control angle: why can’t you judge whether a calibration curve is truly reliable based only on the R2 value?
To make scanning easier, here are the core elements for evaluating calibration curve reliability in a table:
| Evaluation | What to Check | Common Problem | Corrective Action |
| Working Range | Expected sample concentrations fall within the applicable range | Sample exceeds the calibration range | Dilute and reanalyze when permitted |
| Curve Fit | Fit and residuals are consistent with the analytical method | Large deviation at one or more points | Check standard preparation and instrument response |
| QC Verification | Result meets the method-defined acceptance criteria | QC result fails acceptance criteria | Investigate and recalibrate if required |
| R2/Correlation | Consistent with the method and calibration model | High R2 but poor point-wise fit | Review residuals, range, and calibration model |
Beyond the key parameters in the table, when evaluating long-term reliability of an AAS calibration curve, pay special attention to these two points:
Avoid Over-reliance on R² Alone
In daily lab work, many beginners treat the R2 value as the only standard for a passing curve. That is a common misunderstanding.
A high R2 value does not automatically guarantee that every standard point was measured accurately. When concentration spans several orders of magnitude, a high-concentration point can have a large absolute error while the overall R2 still looks ideal. So you must combine residual analysis, QC recovery, and the method’s actual linear range before making a judgment.
Monitor Instrumental Drift
During long runs, an atomic absorption spectrometer can show response drift due to light source heating, burner condition changes, or ambient temperature fluctuation. QC standards and blanks can be analyzed at intervals specified by the analytical method to monitor calibration stability and instrumental drift.
Why Does AAS Calibration Fail?
In practice, we often see poor fitting or failed verification of the AAS calibration curve. Here are common fault symptoms and troubleshooting ideas:
The Calibration Curve Is Not Linear
- Outside the linear range: High- concentration samples can produce a nonlinear response outside the applicable linear range. Solution: shorten the measurement path, for example by rotating the burner angle, or dilute the sample as specified.
- Ionization interference: Some analytes may be affected by ionization under specific flame conditions. Follow the analytical method for the appropriate ionization- control approach.
- Optical path not aligned: the edge of the light spot passes through the atomizer, causing stray light to affect the detector. Solution: redo optical alignment.
The Blank Is Too High
- Reagent contamination: the deionized water or acid used to prepare the blank contains the trace element being measured.
- Sample introduction system carryover: the previous high-concentration sample caused cross contamination in tubing, nebulizer chamber, or graphite tube.
- Container contamination: use of contaminated laboratory ware or sample containers that were not strictly cleaned.
The Signal Is Unstable
- Unstable flame: gas path pressure fluctuation, insufficient fuel gas purity, or carbon buildup in the burner slot.
- Lamp energy decay: the hollow cathode lamp is near the end of its service life, and output light intensity fluctuates sharply.
- Low nebulization efficiency: the nebulizer impact bead position has shifted or the sample capillary is partially blocked.
The Sample Is Outside the Calibration Range
Handling logic: check the reading, confirm it is above the highest point or below the lowest point, use a matched acid blank for gradient dilution as required by the method, re-inject and measure, then multiply by the dilution factor in the final calculation formula.
Choose an DRAWELL AAS That Fits Your Calibration Workflow
Building a high-quality AAS calibration curve requires standardized operation. But an analytical instrument with good response linearity and automated fitting can also significantly reduce daily data calibration workload.
Flame AAS for Routine Element Analysis
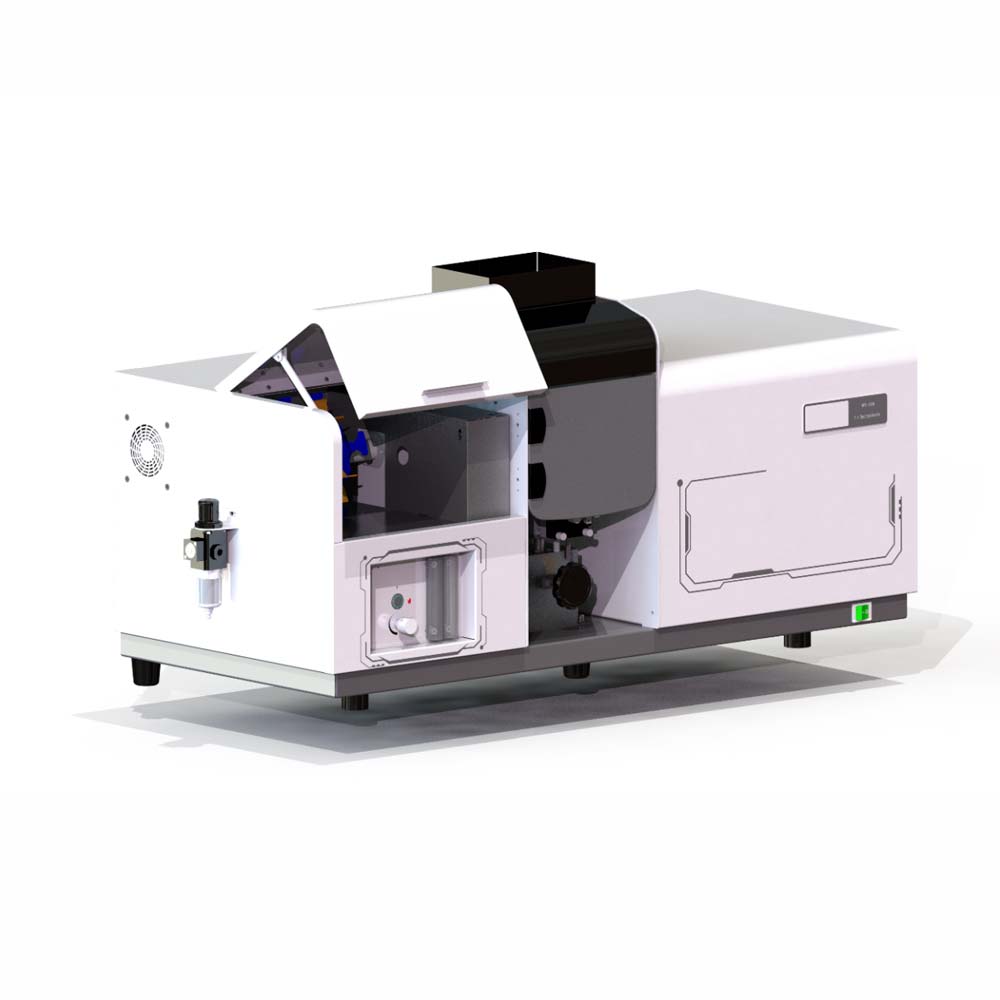
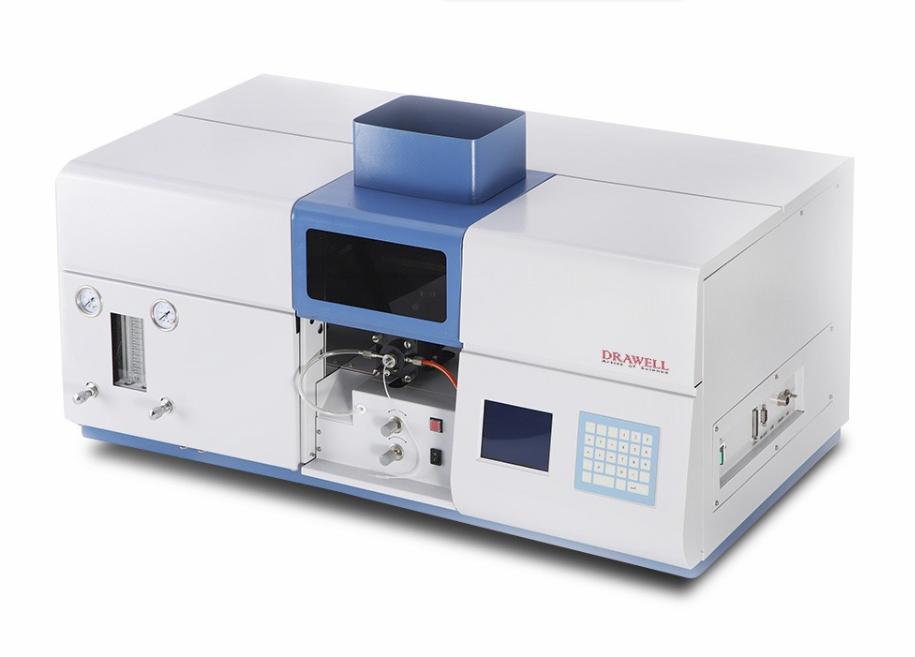
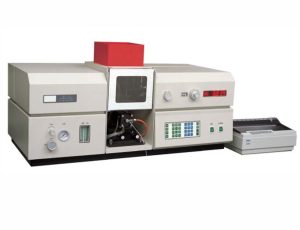
For daily high-throughput major and minor metal analysis, such as copper, iron, zinc, and calcium, the DW- 180B Flame Atomic Absorption Spectrophotometer has built-in automated standard curve fitting and concentration calculation modules. It can report mean, standard deviation (SD), and relative standard deviation (RSD) for replicate measurements in real time. These functions can simplify routine calibration and quantitative data processing.
Graphite Furnace AAS for Trace Analysis
When you need to establish a detection baseline for ultra-trace toxic heavy metals in environmental water or food, the DW- AA320N Double Beam Atomic Absorption Spectrophotometer offers flexible analytical support. Its double- beam configuration, deuterium background correction, and support for different curve- fitting approaches provide flexibility for calibration and quantitative analysis.
Conclusion
A high-level AAS calibration is definitely not just about typing a few numbers into software and getting a nice R2.
From early instrument warm-up, optical path optimization, and reagent blank control, to standard series measurement, curve quality evaluation, and finally QC verification and sample range checks, every step is linked. Following a controlled calibration workflow can help laboratories establish more reliable calibration curves and improve the consistency of quantitative AAS results.
Get Quote Here!
Latest Posts


What Next?
For more information, or to arrange an equipment demonstration, please visit our dedicated Product Homepage or contact one of our Product Managers.


