

Atomic Absorption Spectrophotometry (AAS) is one of the most used analytical methods, for working out the concentration of metallic elements in different sample types. People tend to like it because it is considered accurate, very sensitive, and also dependable across many areas. You can find it in environmental monitoring, pharmaceuticals, food safety, mining, and chemical manufacturing; it kind of covers a broad range. If you understand how an atomic absorption spectrophotometer works, you will also see why it matters for elemental measurements and for quality control.
Understanding the Basics of an Atomic Absorption Spectrophotometer
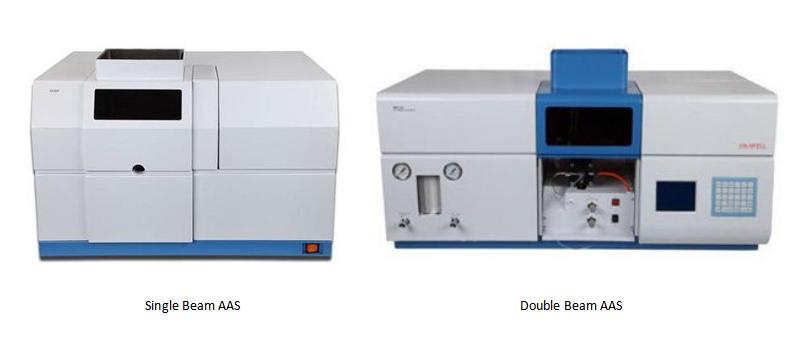
An Atomic Absorption Spectrophotometer (AAS) is an analytical tool that helps you figure out how much of certain metal elements are in a given sample. This method is mostly built on the idea that free atoms, in their basic ground state, will absorb light at very particular wavelengths. So if you check how much light gets taken up, basically how much is absorbed, you can determine the concentration of the element you are after in a pretty reliable way.
The Basic Principle of Atomic Absorption Spectrophotometry
In atomic absorption spectrophotometry, the basic idea is that each chemical element absorbs light at certain wavelengths that match its own atomic layout. So when a sample with metal atoms is brought into a flame or placed into a graphite furnace, those atoms get released into a free and unlinked state. After that, a light beam from a source, tuned to the typical wavelength for the element you want, is sent through the cloud of atoms.
Then the freed atoms take up some of the incoming light energy. As a result, the signal intensity drops, and that fading is registered by a detector. In the end, the reduced light intensity, or the absorbed portion, tracks the element level in the sample in a directly proportional way.
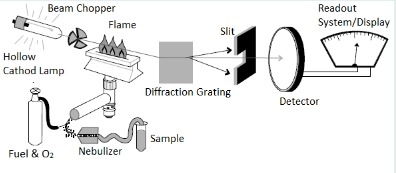
Main Components of an Atomic Absorption Spectrophotometer
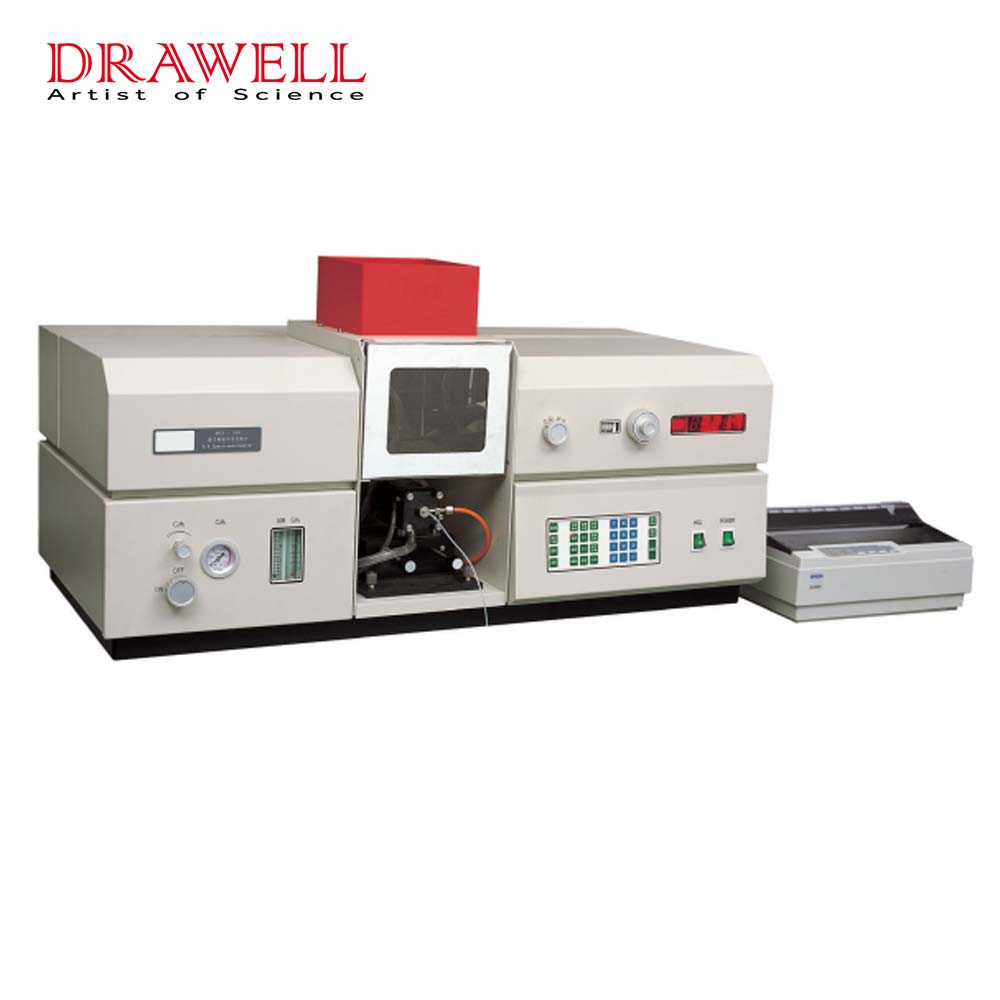
These key components are working together to allow the atomic absorption spectrophotometer to measure how much light is absorbed by free atoms in the sample and accurately determine the concentration of the target element.
| Component | Primary Function | Key Features | Importance in AAS |
| Light Source (Hollow Cathode Lamp/EDL) | Produces characteristic wavelengths specific to the target element | Element-specific spectral emission lines | Ensures selective and accurate elemental analysis |
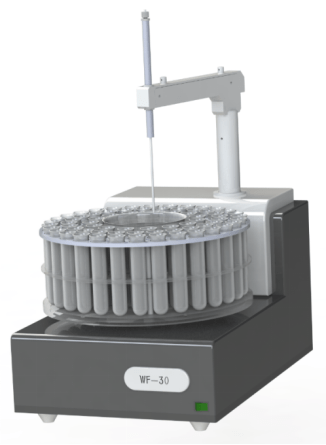
| Sample Introduction System | Converts liquid samples into a fine aerosol | Includes nebulizer, spray chamber, and capillary tube | Enables efficient transfer of sample into the atomizer |
| Atomizer | Converts sample into free ground-state atoms | Flame atomizer or graphite furnace atomizer | Essential for atomic absorption to occur |
| Monochromator | Isolates the desired analytical wavelength | Uses diffraction gratings or prisms | Removes unwanted light and minimizes interference |
| Detector | Measures the intensity of transmitted light | Commonly uses photomultiplier tubes (PMTs) | Converts optical signals into electrical signals for analysis |
| Data Processing System | Processes and displays analytical results | Computer software with calibration and reporting functions | Calculates element concentration and generates reports |
| Background Correction System | Compensates for non-specific absorption and scattering | Deuterium lamp, Zeeman correction, or Smith-Hieftje correction | Improves accuracy and reliability of measurements |
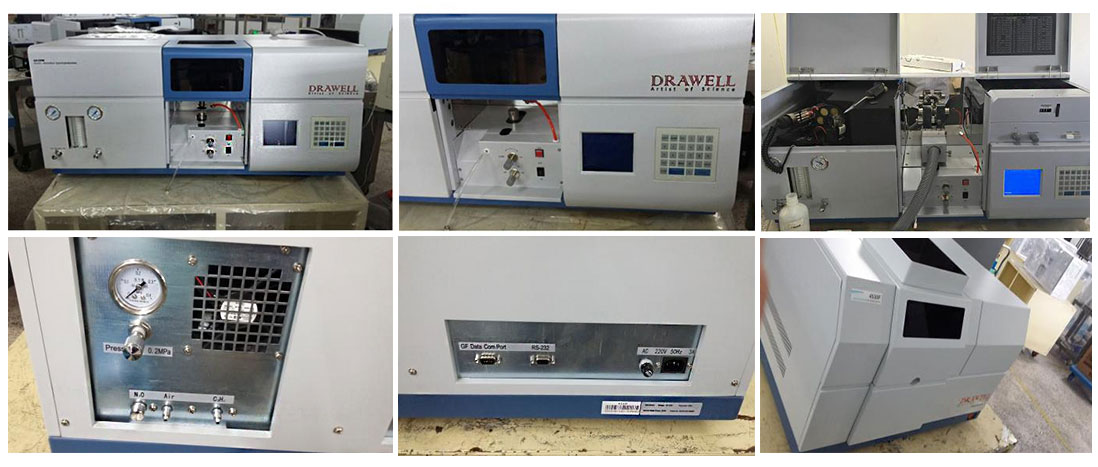
| Gas Control System | Supplies and regulates fuel and oxidant gases for flame atomization | Air-acetylene or nitrous oxide-acetylene systems | Maintains stable flame conditions for precise atomization |
| Power Supply and Control Unit | Controls instrument operation and component functions | Integrated electronics and automation systems | Ensures stable and coordinated instrument performance |
Step-by-Step Working Process of an Atomic Absorption Spectrophotometer
Step 1. Sample Preparation and Introduction
The analytical process starts with sample preparation and honestly, this part matters a lot. Depending on what the material is, the sample might need dissolution, digestion, extraction, or just dilution, so it turns into a consistent liquid solution that can actually be examined. If the preparation is not right, like if digestion is incomplete, or if there is contamination, then the accuracy of the final outputs can be messed up.
After that, the prepared sample goes into the instrument using a sample introduction system. The liquid sample gets pulled into a nebulizer, which turns it into a very fine aerosol, or sometimes a mist. Then the aerosol is pushed through a spray chamber. The spray chamber helps filter out the larger drops and lets mainly the fine particles move on to the atomization area, so the analysis stays repeatable and efficient.
Step 2. Atomization of the Sample
After a sample introduction part, the aerosol goes into the atomizer, and the sample ends up becoming free atoms, in the process. With flame atomic absorption spectrophotometry, the aerosol is pushed into a hot flame made from a combination of fuel together with oxidizing gases. The flame heat does several things at once, it evaporates the solvent, vaporizes the sample, and then it breaks chemical bonds so that free ground-state atoms remain hanging in the flame.
For graphite furnace atomic absorption spectrophotometry, only a small quantity is put into a graphite tube, and that tube is warmed electrically while the temperature follows a programmed sequence. During the heating stages, the material experiences drying, then decomposition, and finally atomization in the furnace, which yields a thick plume of free atoms. This approach gives better sensitivity, and it is especially fit for trace concentration work.
Step 3. Emission of Characteristic Light
As atomization goes on, the instrument’s light source keeps firing out light at wavelengths that match the element under study. Usually, this light is produced from a hollow cathode lamp, inside it is the target element. Since the lamp releases mostly those distinct spectral lines of that same element, it gives the selectivity needed for a solid measurement.
The light then moves through the cloud of free atoms, which gets formed in the atomizer. Only the atoms from the target element are able to take in that specific wavelength, so the method ends up giving very pointed, elemental readings.
Step 4. Absorption of Light by Free Atoms
When the characteristic light passes through the atomized sample, atoms of the target element absorb part of the incoming light energy. How much is absorbed depends on how many atoms are in the optical path. If the sample has a higher concentration of that element, it will absorb more light, but if it has a lower concentration then less light is taken in.
This absorption process is, i mean it basically is the groundwork for quantitative analysis. If you measure how much the light intensity drops, the instrument can then figure out the concentration of the element that is inside the sample
Step 5. Wavelength Selection and Interference Reduction
Once the light has passed through the atom cloud, the leftover beam goes into a monochromator. Inside there, the monochromator isolates the particular analytical wavelength from any stray or unwanted radiation that might still be hanging around. When you pick only the wavelength you care about, it helps tone down spectral interference and makes the measurement more accurate
In modern setups, monochromators use diffraction gratings, which split light into its component wavelengths with high precision. This stage is essential because it helps ensure the detector receives only the intended analytical signal, not other optical noise.
Step 6. Detection of the Analytical Signal
After the filtered light goes on its way it eventually reaches the detector, usually a very sensitive photomultiplier tube. At that stage, the detector gauges the intensity of the transmitted light and it turns that into an electrical signal. Because the transmitted fraction of light drops when absorption increases, the detector gives a fairly direct hint about the concentration of the element you care about.
Now the electrical signal that gets made is amplified and then sent to the instrument’s data processing system for extra examination.
Step 7. Data Processing and Quantification
In the next stage the instrument software handles the detector output and works out the absorbance number. Absorbance basically reflects how much light the sample atoms have taken up. Then, by using calibration standards that have known concentrations, the software builds a calibration curve, and that curve links absorbance with concentration in a usable way.
The absorbance measured for the unknown sample is then matched against the calibration curve, so the instrument can figure out the exact concentration of the element you care about. Also, advanced software tends to run signal averaging, statistical analysis, and a few quality control checks, to keep the results dependable even when the data looks a little messy.
Step 8. Background Correction for Improved Accuracy
In the real world, samples rarely behave perfectly. Materials besides the target element may scatter light or create non-specific absorption. So, modern Atomic Absorption Spectrophotometers usually include background correction systems. Methods like deuterium lamp correction and Zeeman background correction work together, to remove interference and make sure the absorbance you read is driven by the target element only.
This kind of correction is especially crucial for complex matrices, for example biological samples , environmental materials, and industrial products.
Step 9. Result Display and Reporting
Once every computation is finished, the final concentration values appear on the instrument software interface. In modern setups you usually get more complete reporting options too, like calibration records, absorbance measurements, statistical assessments, and quality assurance details. The results might be saved directly to your account, then exported to lab management systems, or printed out for paperwork and regulatory compliance.
Factors Affecting the Working Accuracy of Atomic Absorption Spectrophotometers
Proper optimization of the following factors can ensure reliable and reproducible analytical results of atomic absorption spectrophotometers.
| Factor | How It Affects Accuracy | Potential Consequences |
| Sample Preparation | Incomplete digestion, contamination, or improper dilution can alter analyte concentration | Inaccurate analytical results and poor reproducibility |
| Nebulization Efficiency | Uneven aerosol generation affects the amount of sample reaching the atomizer | Signal fluctuations and reduced precision |
| Atomization Efficiency | Incomplete conversion of the sample into free atoms reduces absorption | Lower sensitivity and inaccurate concentration measurements |
| Flame Stability | Variations in flame temperature or gas flow affect atom production | Poor repeatability and unstable readings |
| Graphite Furnace Conditions | Incorrect temperature programming can cause analyte loss or incomplete atomization | Reduced recovery and inaccurate results |
| Lamp Performance | Aging lamps or unstable light output reduce signal quality | Increased noise and measurement errors |
| Monochromator Performance | Poor wavelength isolation allows unwanted light to reach the detector | Increased background interference |
| Detector Sensitivity | Detector drift or reduced sensitivity affects signal measurement | Lower precision and unreliable results |
| Background Absorption | Matrix components may absorb or scatter light along with the analyte | False absorbance readings and overestimation |
| Chemical Interference | Formation of stable compounds can prevent complete atomization | Lower analyte recovery and underestimation |
| Ionization Interference | Some elements may ionize at high temperatures, reducing free atom concentration | Reduced absorption signals |
| Calibration Quality | Poorly prepared standards or incorrect calibration procedures affect quantification | Systematic measurement errors |
| Instrument Maintenance | Dirty burners, clogged nebulizers, or misaligned optics reduce performance | Decreased accuracy and sensitivity |
| Environmental Conditions | Temperature fluctuations, vibrations, and electrical noise can affect instrument stability | Increased signal variability |
| Operator Technique | Incorrect instrument setup or sample handling can introduce errors | Inconsistent and unreliable results |
Final Thoughts
The working process of an Atomic Absorption Spectrophotometer involves a carefully coordinated sequence of sample preparation, atomization, light absorption, wavelength selection, signal detection, and data analysis, kind of. By converting a sample element into free atoms, and then measuring their characteristic light absorption, AAS gives very accurate and highly sensitive elemental analysis. Its simple operating principle, together with advanced automation and background correction technologies, makes it one of the most trusted analytical methods for metal determination.
Get Quote Here!
Latest Posts


What Next?
For more information, or to arrange an equipment demonstration, please visit our dedicated Product Homepage or contact one of our Product Managers.


