


You do an FTIR analysis and then do it again on the same sample a few minutes later and the two spectra seem considerably different. The peaks shift, the baseline slopes change or a band you weren’t expecting all of a sudden arrives. If this has happened to you, you are not the only one. The good part is that the cause is usually something you can adjust.
In this guide, we’ll examine the five major reasons that the same sample can provide various FTIR spectra, and what you can do about each one.
What Is Different Between the Two Spectra?
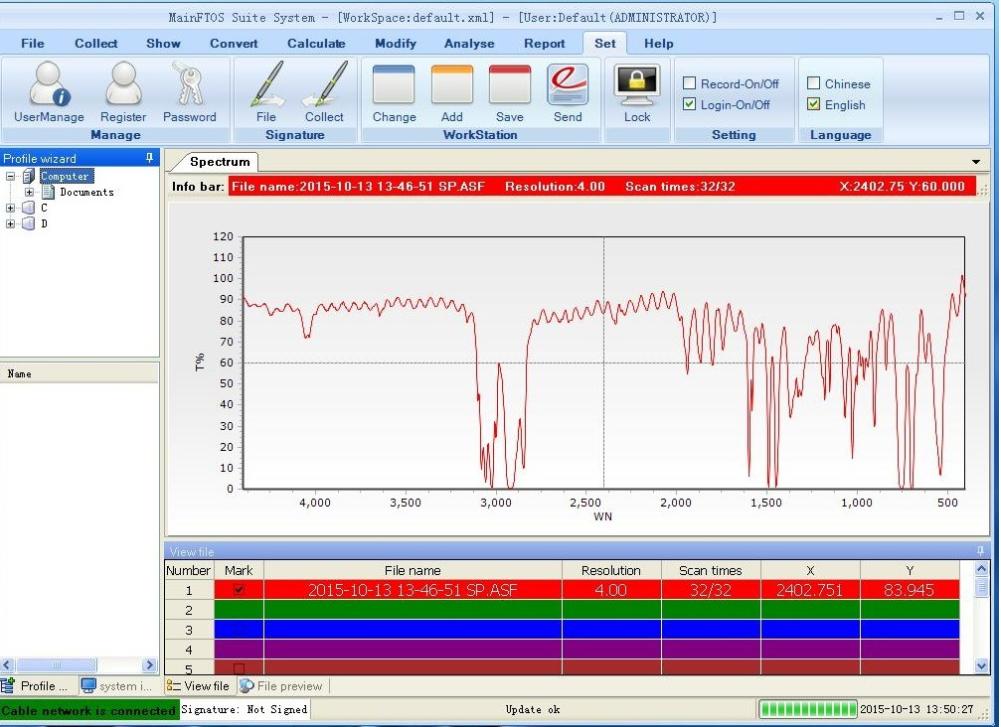
Before you jump to a conclusion, look closely at what actually changed. When two FTIR spectra from the same material do not match, the mismatch often falls into a few simple types. Peaks can shift. Peak heights can change. The baseline can slope or curve. New bands can appear. Those new bands are often from water vapor or carbon dioxide. When you sort the change this way, it is easier to test possible causes instead of guessing.
1. The Part of the Sample You Measure
Many solid and semi-solid materials are not perfectly uniform throughout. A polymer film may have thicker edges. A pressed pellet might have denser regions in the center. A coating on a substrate can vary in thickness from one spot to another.
If you take readings at a new spot on the same sample, you are not getting exactly the same material. This is often missed when people wonder why FTIR results from one specimen do not line up. The issue stands out more in ATR, since the IR beam only reaches a small region, usually just a few square millimeters per reading.
If you think the sample is not even, measure multiple points and combine the results. Another option is to run a scan map so you can see how the composition shifts across the surface.
2. Sample Preparation
Sample preparation is a big deal in FTIR analysis. Common choices for sample preparation include pressing KBr pellets, producing thin films, mulls, or putting samples directly on the ATR crystal. Each method involves variables that can shift the final spectrum.
The ratios of sample to KBr, the applied pressure and the thoroughness of the grinding of the combination all influence the peak intensities and the overall shape of the spectrum for KBr pellets. Small changes in particle thickness can even enhance the appearance of the absorption bands.
With the films the unequal thickness across the film gives variation which is impossible to regulate unless you are careful to cast or press evenly. The main message: If you slightly vary your preparatory methods between runs, expect the FTIR spectra to reflect it.
3. ATR Contact
ATR attachments are very convenient but are also quite sensitive to the quality of the contact between the sample and the crystal. If the sample is either too rigid or too rough, or if it does not press flat on the crystal surface, the effective path length changes, and the spectrum changes too.
- Inconsistent pressure: Changing the clamping force can change the quality and area of contact between the sample and ATR crystal, which can affect the intensity of the measured bands.
- Sample surface condition: A smooth flat surface is preferred to a rough or powdery surface for better contact of the crystal. Powders in particular need to be pressed firmly and evenly.
- Crystal contamination: A thin film of residual material from a prior sample can mislead the following measurement.
These considerations are why two operators running the same sample on the same instrument will often receive markedly different ATR spectra.
4. Moisture and Contamination
Water vapor can produce unexpected bands, especially in the O–H stretching region around 3700 cm⁻¹. Atmospheric CO₂ can also introduce interference, particularly around 2350 cm⁻¹. If the spectrometer optical route is not thoroughly purged, or if the background was collected under different humidity circumstances than the sample scan, such water vapour bands will show up in the final spectrum.
Similar effect is caused by contamination from residue on the ATR crystal or sample container. Any previous sample that hasn’t been entirely cleaned off will contribute its own absorption properties, resulting in a spectrum that is more like a mixture than a pure substance. Always clean the crystal or sample holder well between measurements and be consistent in your background collection (when and how).
5. Instrument Settings and Data Processing
Even when the materials and the preparation are the same, differing instrument settings can lead to FTIR spectra that look very different from each other.
- Spectral resolution: The lower the resolution (e.g., 16 cm⁻¹ versus 4 cm⁻¹) the more the peaks are broadened and the two neighbouring bands can be perceived as one, which modifies the shape and the apparent position of the absorption features.
- Number of scans: The fewer scans, the more noise in the baseline. More scans increase the signal-to-noise ratio and yield a clearer spectrum.
- Spectral range: Collecting over a tighter or wider wavenumber range does not change the chemistry, but it influences what you observe and might cause confusion if ranges differ between measurements.
- Apodization and data processing: Different software-based functions employed during the Fourier transform might lead to modest changes in resolution and lineshape.
To rule out instrument settings as a source of variation, always confirm that all parameters match before comparing two spectra.
How to Tell Whether the Difference Is a Problem
Not every difference between two FTIR spectra is a red flag. Small changes in baseline slope or peak intensity can occur within normal measurement variability, especially for solid samples measured by ATR.
The concern arises when peak positions shift significantly, new bands appear that cannot be explained by water vapor or CO₂, or relative peak ratios change in ways that suggest a genuine compositional difference.
A good rule of thumb: if the pattern of major peaks is consistent and the differences are limited to baseline and intensity, the issue is usually experimental. If the peak pattern itself changes, investigate sample homogeneity or contamination first.

Get More Consistent FTIR Results
Based on what we have covered, here is a straightforward checklist to reduce variability in your FTIR measurements:
- Keep sample preparation consistent across all measurements.
- Use the same sampling method and accessories every time.
- Clean the ATR crystal or sample holder thoroughly between measurements.
- Control moisture exposure and avoid unnecessary contact with open air.
- Keep resolution, scan number, and spectral range consistent.
- Collect background under stable conditions, ideally right before the sample scan.
- Repeat measurements whenever an unusual spectrum appears.
Understanding the factors affecting FTIR results takes some experience, but once you know what to look for, troubleshooting becomes much more straightforward. At Drawell, we work with laboratory users across a wide range of industries and have seen firsthand how small procedural changes can make a real difference in measurement consistency.
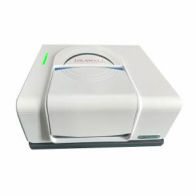
If you are looking for reliable FTIR spectrophotometers backed by strong technical support, explore our FTIR spectrophotometer range or contact us to find the right setup for your lab.
Get Quote Here!
Latest Posts




What Next?
For more information, or to arrange an equipment demonstration, please visit our dedicated Product Homepage or contact one of our Product Managers.


