


In any chemical analytical lab, spotting potential errors in titration experiments early on makes all the difference between reliable results and wasted time.
Titration is one of those classic techniques that seems simple on paper. But in practice? There’s a lot that can go sideways. From how you prepare your sample and handle your glassware, to which indicator you pick and how you read the burette – every step carries some risk of small deviations creeping in. And here’s the thing: those tiny slip-ups tend to pile up. Before you know it, your data integrity starts to crack.
Understanding where those variations actually come from helps you stay ahead of the game. You can put preventive measures in place and keep your quality assurance standards high without constantly putting out fires.
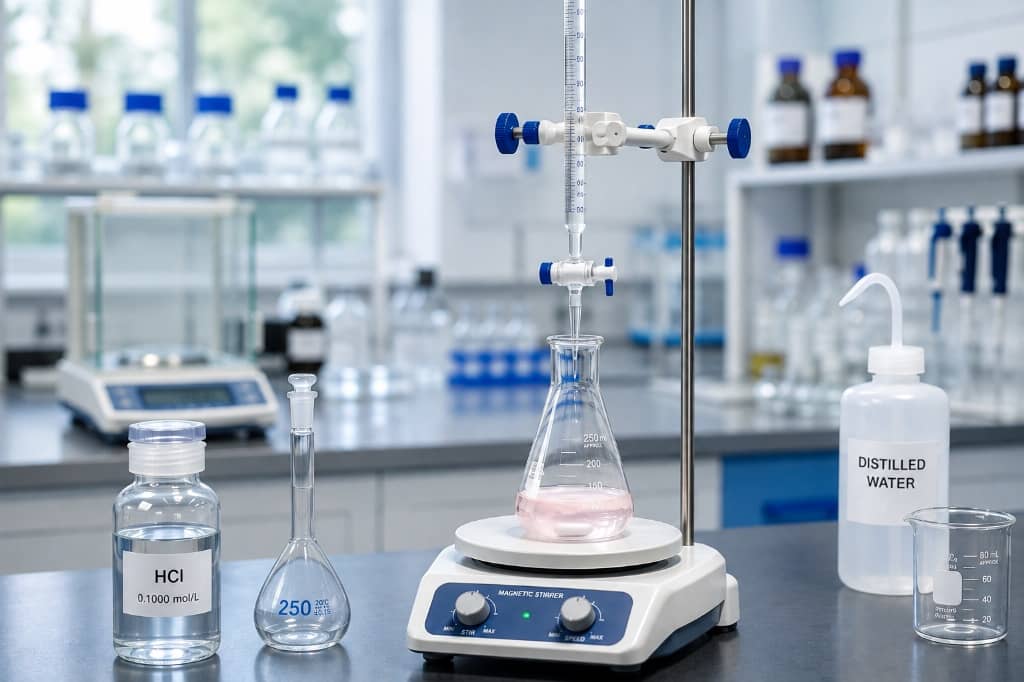
What Are Systematic and Random Errors in Titration?
So, titration errors. They split into two main types. Systematic and random. Why does that distinction matter? Because knowing which one you’re dealing with points you straight to the real problem. And once you know that, you can actually fix it.
Think about systematic errors first. These push your results consistently too high or too low, every single time. They hit your accuracy, plain and simple. Imagine an uncalibrated balance. Or a titrant with a concentration that’s off. Or always reading the burette from a slightly wrong angle. These aren’t one-off mistakes; they repeat themselves, same direction, over and over.
Now, random errors. These are different. They show up as unpredictable scatter around the average. They mess with your precision. Maybe you judge the color change a little differently each time. Or your readings fluctuate slightly and you can’t quite reproduce them. They’re erratic, and they keep you guessing.
Accuracy versus precision? Worth a quick reminder. Accuracy is about how close your measured value is to the true or target value. Precision is about how tightly your repeated measurements cluster together. They’re not the same thing, and you need both if you want results you can trust.
Endpoint vs. Equivalence Point: Why Does the Difference Matter?
Here’s a core concept in volumetric analysis: the equivalence point and the endpoint are not the same thing. They’re not interchangeable at all.
The equivalence point is the theoretical one – the exact point where the moles of titrant match the stoichiometric reaction with your analyte. It’s what the chemistry says should happen. The endpoint, on the other hand, is what you actually observe. That color change, or that potential jump. That’s your practical stop signal.
The gap between them? That’s endpoint error. You can shrink it by choosing the right indicator or by switching to potentiometric detection. It’s a small detail with a big impact.
1. Parallax Error Can Cause Wrong Burette Readings
Reading a burette? Sounds easy enough. But your eye level matters. A lot. If you’re looking from above or below, the meniscus appears to shift relative to the scale. That visual offset becomes a volume error. Straightforward as that.
So for clear aqueous solutions, keep your eye exactly level with the bottom of the meniscus. If you’re dealing with dark or opaque solutions, follow your lab’s SOP – it might specify a different reading position. Either way, consistency is everything. Do it the same way every time.
2. Improper Glassware Rinsing Can Change the Result
How you prep your glassware before starting can quietly alter your concentrations or the actual amount of substance you’re working with.
Burettes and Transfer Pipettes: Some methods require you to rinse these with the solution they’ll be holding – whether that’s the titrant or the sample. Skip this, and leftover water droplets will dilute whatever you’re delivering, throwing off your volume measurements.
Conical Flasks: Here’s a common slip-up. Don’t rinse the flask with your sample solution. Just use distilled or deionized water. If you rinse with the analyte, you’re adding extra solute into the flask. That means you’ll consume more titrant. And your final concentration ends up falsely high. Easy to avoid once you know.
3. Air Bubbles Can Distort the Titrant Volume
Air bubbles lurking in the tip? They’ll fool your volume reading. Here’s why: some of the volume you record actually goes toward pushing that bubble out, not toward reaching your sample. The result? Your recorded titrant volume looks bigger than what was actually delivered.
Fix it before you zero the burette. Open the stopcock fully and let a steady stream of liquid flush through the tip. Watch carefully until you see no bubbles clinging to the outlet. It takes just a few seconds, but it saves a lot of headache later.
4. The Wrong Indicator Can Shift the Endpoint
Visual indicators are all about color changes tied to chemical shifts. But they only work well if their transition range matches your system’s pH jump.
How to choose: The indicator’s transition range should bracket the pH spike around the equivalence point. For instance, phenolphthalein works well for weak acid–strong base titrations, while methyl orange is a better fit for strong acid–weak base. Using the wrong one? You’ll see the color change at the wrong time, plain and simple.
Watch the amount: Most indicators are weak acids or bases themselves. Add too much, and they start consuming titrant. Stick to the number of drops specified in your method. A little goes a long way.
5. Over-Titration Can Cause an Incorrect Result
Near the end of a titration, the urge to speed up is real. But pouring it in too fast right at the finish line often backfires.
What happens: As you get close to the endpoint, adding too much titrant in one go can shoot right past the target. The volume you record ends up higher than what the reaction actually needed. Plus, if your color judgment lags a bit, that only makes it worse.
Better approach: Slow way down when you sense the endpoint approaching. Switch to half-drops or even single drops. And if your method specifies a color persistence time, wait that out before recording the final volume. Patience pays off here.
6. Temperature and CO₂ Can Change Titrant Behavior
Your lab’s environment isn’t static, and that can mess with your standard solutions over time.
Temperature effects: Heat expands liquids, cold contracts them. Since volumetric concentrations depend on volume, temperature swings actually change your molarity. Most glassware is calibrated at a standard reference temperature – stray too far from that, and your volume measurements drift.
CO₂ absorption: Alkaline titrants like sodium hydroxide love to suck up carbon dioxide from the air. That forms carbonate and shifts the effective concentration. Use CO₂ traps or protection devices as specified in your SOP, and restandardize your titrants regularly. Don’t assume they stay the same.
7. Weighing and Calculation Errors Can Affect Accuracy
Your final result is only as good as the weighing and the math that feed into it. That’s just how it is.
Mass measurement errors: If your reference standard or sample isn’t weighed correctly, everything downstream inherits that error. Use a calibrated analytical balance that meets your method’s precision requirements. It’s your first line of defense.
Calculation slip–ups: The usual culprits? Forgetting dilution factors. Plugging in the wrong molar mass. Ignoring the stoichiometric ratio – like mixing up a 1:1 reaction with a 1:2 one. Double-check your formula every single time. It’s worth the extra moment.
8. Poor Mixing Can Affect Endpoint Detection
You’d think adding titrant and stirring is straightforward, but uneven mixing causes real problems.
How it works: Inadequate stirring creates localized zones where titrant concentration is much higher than the bulk solution. Your indicator or electrode might respond to that pocket before the whole flask has reached equilibrium. That means you’ll call the endpoint too early or get inconsistent signals.
Control it: Use a magnetic stirrer at a steady, moderate speed. Make sure the electrode tip is fully immersed in the well-mixed area – and crucially, don’t place it right under the titrant delivery point. Also, avoid vortexing so hard that you pull air bubbles into the solution.
9. Wrong or Degraded Reagents Can Skew the Result
Old or contaminated reagents? They mess with the underlying chemistry in ways that aren’t always obvious. Titrant concentrations can drift over time – evaporation, decomposition, or absorbing atmospheric CO₂ all play a part. That’s why you need a strict expiry tracking system and regular restandardization with fresh reference materials. Don’t rely on old data.
10. Poor Calibration and Leaks Can Cause Systematic Errors
Hardware wears out. Seals age. Sensors drift. All of this introduces steady bias into your results.
Hardware red flags: Leaky stopcocks, worn dispensing tubing, uncalibrated automated dispensers, and aging pH or potentiometric electrodes – they all distort either your delivered volume or your signal detection.
Maintenance routine: Implement a regular inspection and calibration schedule for all dispensing and sensing equipment. Check for good seals, stable delivery performance, and reliable electrode response. It’s not exciting, but it’s essential.
Step-by-Step Checklist to Prevent Titration Errors
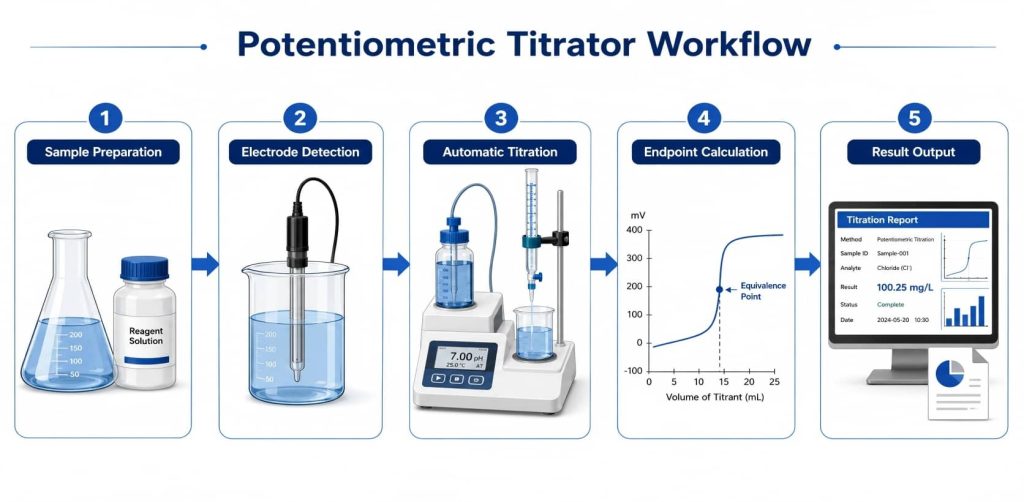
Working through a structured prep routine can dramatically cut down on oversights and improve consistency across replicates.
Step 1: Inspect and verify equipment calibration – Check the calibration due dates for your balance, dispensing hardware, and potentiometric sensors.
Step 2: Verify reagent concentration and freshness – Make sure your standard titrant is within its shelf life and has been recently standardized accurately.
Step 3: Prepare the glassware – Clean all needed glassware according to SOP, and precondition it when the method demands it.
Step 4: Remove air bubbles – Flush the liquid lines and burette tip to eliminate air, then zero it precisely at eye level.
Step 5: Set up proper stirring – Adjust the magnetic stirrer to create a steady, splash-free flow that doesn’t pull in air.
Step 6: Perform titration – Add titrant at a controlled rate, switching to micro or half-drop control as you approach the endpoint.
Step 7: Record and verify results – Note the final volume with a digital readout or at eye level, then double-check stoichiometry and dilution calculations.
Step 8: Repeat according to SOP – Run enough replicates as specified by your method. In academic settings, three or more repeats are common, but always follow your official procedure and acceptance criteria.
Manual Titration vs. Automatic Potentiometric Titration
Moving from manual techniques to automated instrumentation addresses a lot of operator-related variability. Here’s a quick comparison:
| Aspect | Manual Titration | Automatic Potentiometric Titration |
| Endpoint Detection | Visual color change (operator-dependent) | Potentiometric signal changes measured by electrode |
| Titrant Dosing | Manual stopcock control | Stepper-motor driven automated burette |
| Volume Reading | Manual reading at eye level | Instrument records volume digitally |
| Repeatability | Highly dependent on operator technique | Better consistency with validated methods |
| Data Recording | Handwritten logs | Automated digital storage with traceability |
| Main Error Sources | Parallax, color bias, overshooting | Electrode condition, method parameters, calibration |

Which Errors Can Automatic Titration Reduce?
Automation helps cut down on visual endpoint bias, parallax errors in reading, inconsistent stopcock control that leads to overshooting, and transcription mistakes when copying data by hand. If those are your pain points, it’s worth a look.
Which Errors Still Require Proper Laboratory Practice?
Here’s the thing about automation: it doesn’t fix a bad method or a mislabeled reagent. Sample weighing accuracy, reagent purity, electrode maintenance, and correct method parameter setup? That’s still on you. The instrument is a tool – you’re still the brains behind the operation.
How Drawell Potentiometric Titrators Support Reliable Results
If you want to reduce manual variability, automatic potentiometric titrators combine dosing, endpoint detection, and data logging into one streamlined workflow. Drawell’s automatic potentiometric titrators can help reduce operator-related inconsistencies. They do automated titrant delivery, electrode-based endpoint detection, curve analysis, and digital recordkeeping. That adds up to better reproducibility across runs.
Conclusion: How to Get More Reliable Titration Results
Cutting down on potential errors in titration experiments? It’s about solid lab technique, proper glassware handling, regular equipment checks, and following your SOP with care. Keep an eye on the usual suspects – parallax, rinsing habits, temperature shifts, and indicator choices. Do that, and your data will be much more trustworthy.
And if you’re at a point where you want better consistency, easier data management, and less operator-to-operator variation, automation is a proven path forward. Check out Drawell to explore potentiometric titrators and other lab analysis tools that fit your needs.
Get Quote Here!
Latest Posts
No posts
What Next?
For more information, or to arrange an equipment demonstration, please visit our dedicated Product Homepage or contact one of our Product Managers.


