

This comprehensive guide introduces the core principles of X-Ray Diffraction (XRD), practical sample preparation tips, and advanced phase analysis to help researchers and procurement managers transition from theory to laboratory practice.

What Is the XRD Principle?
The principle of X-ray Diffraction (XRD) is based on the interaction between X-ray beams and the atomic structure of crystalline materials. This process can be broken down into three logical stages:
Interaction at the Atomic Level
When a beam of monochromatic X-rays irradiates a crystal, the electrons surrounding the atoms vibrate under the influence of the periodically changing electric field of the X-rays. As a result, each electron becomes a secondary wave source that emits spherical electromagnetic waves. The frequency of these emitted waves corresponds exactly to the incident X-rays.
Coherent Scattering and Interference
Based on the periodicity of the crystal structure, these scattered waves from individual atoms interfere with each other and superimpose. This phenomenon is known as coherent scattering or diffraction. Essentially, the diffraction pattern produced by a crystal is the result of mutual interference among the scattered waves of a large number of atoms, reflecting the precise distribution of atoms inside the crystal.
Key Characteristics of the Diffraction Pattern
According to the XRD principles above, every crystal produces a unique diffraction pattern characterized by two main factors:
- The Distribution Law (Position): The spatial distribution of diffraction lines is determined by the size, shape, and orientation of the unit cell.
- The Intensity: The brightness or strength of the diffraction beams depends on the species of atoms and their specific positions within the unit cell.
Since no two different minerals or compounds have identical atomic arrangements, they will never produce the same diffraction pattern. This makes XRD the most reliable “fingerprint” for identifying crystalline phases.
What Is the Bragg Equation Used in XRD?
The Bragg Equation used in XRD
2dsinθ=nλ
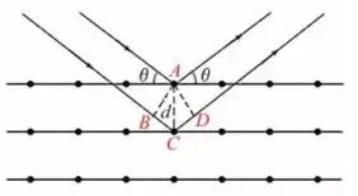
Among them, n is the diffraction order. θ is the angle between the incident ray and the branch ray. θ is half of the diffraction angle, and 2θ is called the diffraction angle.
The Bragg equation reflects the relationship between the direction of the diffraction lines and the crystal structure. For a specific crystal, only the incident ray angle that satisfies the Bragg equation can produce interference enhancement and will show diffraction fringes. This is the fundamental meaning of XRD patterns.
Note: For different crystal systems, there is a definite correspondence between the interplanar spacing d and the unit cell parameters (a, b, c, α, β, γ). After knowing θ and hkl from the XRD spectrum, the Bragg equation can be used. The Bragg equation of XRD can calculate the unit cell parameters.
Scherrer formula using in XRD
Basic principle: When an X-ray is an incident on a small crystal, its diffraction lines will become diffuse and broadened. The smaller the crystal grain, the greater the broadening of the X-ray diffraction band. The Sherrer formula describes the relationship between the grain size and the half-width of the diffraction peak.
The Scherreer formula: D=Kλ/(βcosθ)
The use of this equation to calculate the average grain size requires attention:
1. β is the half-peak width, that is, the width where the diffraction intensity is half of the maximum value, and the unit is expressed in radians.
2. D only represents the grain size in the normal direction of the crystal plane, and has nothing to do with the grain size in other directions.
3. k is the shape factor, k=1.075 for spherical particles, and k=09 for cubic crystals. Generally, k=1 is taken when the requirements are not high.
4. The measurement range is 3~200nm.
Basic principle: Every crystalline substance and its diffraction pattern have a one-to-one correspondence, and it is impossible for two crystals to give the same diffraction pattern.
From Theory to Practice: 3 Steps for High-Quality Data
To move from textbook theory to reliable lab results, follow these practical steps:
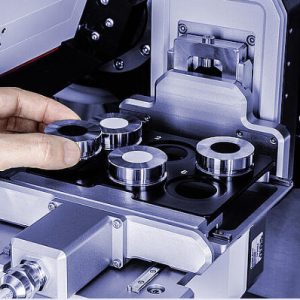
Step 1: Professional Sample Preparation
The quality of your XRD pattern depends 80% on sample prep.
- Particle Size: For powder XRD, grind the sample to $<45 \mu m$ to ensure random orientation.
- Flatness: Ensure the sample surface is perfectly flush with the holder to avoid “Displacement Error” in peak positions.
- Quantity: Even a small amount of “thin film” or “trace powder” can be analyzed using specialized Zero-Background Holders (ZBH).
Step 2: XRD vs. XRF – Choosing the Right Tool
Many procurement managers confuse XRD with XRF. Here is the key difference:
- XRF (X-Ray Fluorescence): Tells you WHAT elements are there (e.g., Fe, Cu, Si).
- XRD (X-Ray Diffraction): Tells you HOW atoms are arranged (e.g., Is it Fe2O3 or Fe3O4?).
Step 3: Phase Identification (Qualitative Analysis)
With the improvement of the XRD standard database, XRD phase analysis has become simpler. At present, the most common operation method is to compare the XRD spectrum of the sample with the standard spectrum to determine the phase composition of the sample. The XRD standard database includes JCPDS (ie PDF card), ICSD, CCDC, etc. It is recommended to use the Drawell X-Ray Diffractometer to analyze the XRD spectrum.
In the Drawell X-Ray Diffractometer, you can compare the diffraction pattern of the sample with the standard spectrum, giving the standard spectrum information that matches the measured sample.
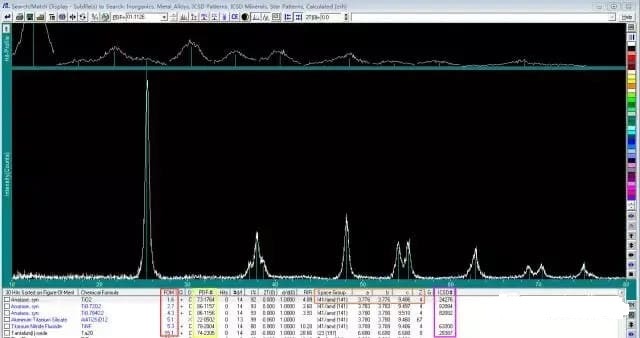
As shown in the figure above, Drawell X-Ray Diffractometer will give the diffraction fringes, phase name, chemical formula, degree of matching (FOM), PDF card number, point group, unit cell parameters, ICSD number, etc. of the standard spectrum.
Among them, FOM is the reciprocal of the matching rate. The smaller the value, the better the matching.
The selected standard material card will pop up the detailed references and diffraction data values of the standard material. The data include the interplanar spacing d, the crystal plane index hkl, and the position and relative intensity of diffraction peaks in the standard spectrum.
Benchtop vs. Vertical XRD: How to Choose
| Feature | Desktop/Benchtop XRD (e.g., DW-XRD-27mini) | Vertical/Full-Size XRD (e.g., DW-XRD-Y3500) |
| Best For | Quality Control, Teaching, Small Labs | Advanced Research, Thin Films, High Precision |
| Footprint | Compact, no special cooling needed | Larger, requires dedicated space |
| Power | 600W – 1KW | 3KW – 4KW |
| Advantage | Cost-effective, easy to maintain | High intensity, faster data collection |


FAQs
Can XRD analyze liquid or amorphous samples? XRD is primarily for crystalline materials. Amorphous materials like glass produce a broad “halo” rather than sharp peaks. Liquids generally require specialized X-ray scattering techniques.
What is the minimum sample amount required? While standard holders need a few grams, using a “Zero Background Holder” (ZBH) allows for high-quality data from as little as a few milligrams.
Why are my XRD peaks shifted compared to the PDF card? Shifts are usually caused by sample displacement (not flat), lattice strain, or solid solution effects where different-sized atoms substitute into the lattice.
How often should an XRD instrument be calibrated? For industrial QC, a monthly check using a standard material (like LaB6 or Silicon) is recommended. For research, check calibration before critical runs.
Is the radiation from a benchtop XRD safe? Yes. Modern benchtop units like the Drawell DW-XRD-27mini feature full radiation shielding and interlocks, ensuring leakage is far below international safety limits (<1 μSv/h).
Related Products Recommendation

Get Quote Here!
Latest Posts


What Next?
For more information, or to arrange an equipment demonstration, please visit our dedicated Product Homepage or contact one of our Product Managers.


