

Coal is a complex organic macromolecule composed of multiple functional groups and multiple chemical bonds. From the perspective of chemical structure, coal is a short-range ordered and long-range disordered amorphous solid organic matter, which obtains the structure of its aromatic crystal nucleus. Parameters are important content. And the best aromatic nucleus detection instrument is the raman spectrometer.

What Is Raman Spectroscopy?
Raman spectroscopy is a type of scattering spectroscopy and is an integral part of spectral analysis techniques. Raman spectroscopy is an analysis method based on the Raman scattering effect, which analyzes the scattering spectrum with different frequencies from the incident light to obtain information on molecular vibration and rotation. It is applied to the study of molecular structure.
Raman spectroscopy has applications in materials, chemicals, petroleum, polymers, biology, environmental protection, geology, and other fields. With the continuous development of Raman technology, its application range is becoming more and more extensive.
Raman spectroscopy is very sensitive to the structural order state of carbon materials and can provide reliable information for the degree of structural order. It is one of the most commonly used, non-destructive, fast, and high-resolution techniques for characterizing carbon materials. Therefore, Raman spectroscopy is often used to describe the structural features of carbonaceous materials such as graphite.
Coal has the characteristics of high carbon material and is similar in structure to polycrystalline graphite. The following is the Raman spectrum of graphene and coal tested with our Opto-Tiancheng portable Raman spectrometer ATR3110-532. It can be seen from the graph that the Raman characteristic peaks of the two are close.
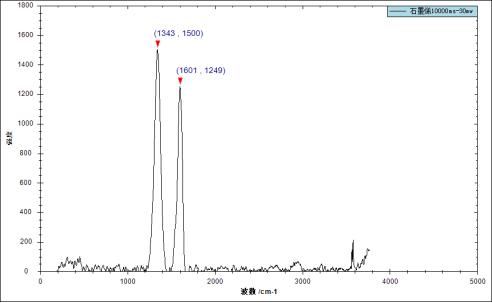
The Raman spectrum results of this test have obvious distinguishing characteristic signals around 1343cm-1 and 1601cm-1.
If the sample is replaced with coal, the integration time is 10000ms, and the excitation power is 50mw, the following data will be obtained:
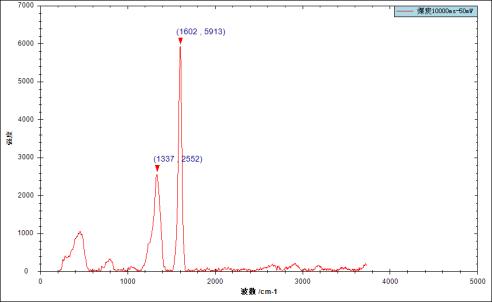
The Raman spectrum results of this test have obvious distinguishing characteristic signals around 1337cm-1 and 1602cm-1.
Raman spectroscopy of natural organic matter in carbonaceous compounds such as coal shows that the Raman bands correlate with the structural composition of amorphous carbon.
The most significant difference between coal and general macromolecular organic compounds is that it has unique complexity, diversity, and inhomogeneity, and no uniform chemical structure exists in any part of the same piece of coal. According to the Raman spectrum of natural organic matter in coal, its Raman band is related to the structural composition of amorphous carbon.
Su Xianbo et al. conducted Raman spectroscopy tests on coals with different degrees of metamorphism and deformation. They found a close relationship between the microcrystalline coal structure, its evolution, and the Raman spectral characteristics. This results in a sharp increase in the peak head difference (G-D1) and a sharp decrease in the half-width ratio (G/D1).
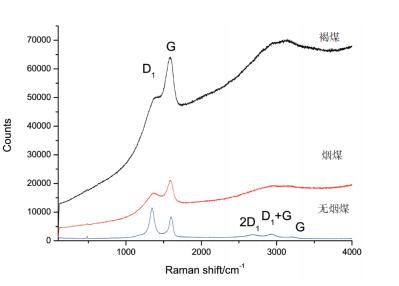
As shown in Table 1 and Figure 1, the Raman parameter differences and Raman curves of three different types of coals are compared. It can be seen that the Raman band is related to the structural composition of coal. With the increase in coalification degree, the specific performance is as follows:
(1) The position of the D1 peak moves to the low wavenumber region, and the G peak position moves to the high wavenumber region, so the peak distance between the D1 peak and the G peak: lignite < bituminous coal < anthracite.
(2) The sharper the D1 peak and the G peak, the lower the peak height ratio (G/D1) value, so the peak height ratio (G/D1): lignite > bituminous coal > anthracite. The difference is obvious.
(3) Anthracite has weak Raman scattering at 2500-3250 cm-1, and the second-order mode is more obvious. The second-order mode of lignite and bituminous coal are superimposed together to form an obvious and gentle steamed bread peak.
We can quickly identify the type of coal based on the above Raman spectrum curve.
The Main Reasons for the Difference in Raman Parameters of the Above Coals:
①The degree of coalification of lignite is the lowest, the carbon content is the least, and the volatile content is the most. Bituminous coal is a kind of coal transformed from lignite through metamorphism, and its volatile content is 10% to 40%.
Generally, it decreases with the increase in the degree of coalification. The degree of coalification is higher than that of lignite and lower than that of anthracite. Anthracite is the coal with the highest degree of coalification in China’s port science and technology.
② The D1 peak is mainly the C-C bond vibration peak between the aromatic ring and the aromatic compound; the G peak is the aromatic ring breathing vibration, the C=C bond vibration, and the characteristic peak of graphite. With the change in volatile content, the difference in aromatization and aromatic ring condensation is caused, which leads to a corresponding change in the relationship between the D1 peak and the G peak.
The higher the degree of coalification, the alkyl side chains, oxygen-containing functional groups, and small molecular compounds in the coal gradually decrease to disappear and are replaced by the superposition and accumulation of more ordered aromatic carbon and aromatic layers, and the proportion of volatile matter content The smaller the value, the sharper the peak shape of the peak band.
③ The secondary mode is affected by the D1 peak and the G peak and is its frequency peak, which also changes with the change of the D1 rise and the G peak. The higher the degree of coalification, the broad and gently steamed bread peak gradually split into three distinct peaks (2D1 peak band, D1+G peak band, and 2G peak band).
Epilogue
Raman spectroscopy can provide quick, simple, repeatable, non-destructive qualitative and quantitative analysis and has been widely used in the field of the coal chemical industry. It provides a vital detection method to prevent the import of low-quality coal.