
Knowing the distinctions between analytical instruments is vital for businesses that rely on accurate chemical analysis. One of the two commonly utilized tools are gas chromatography (GC) and infrared spectrometer (IR). Each has its own purpose and is highly effective in certain situations. This article will discuss the underlying principles of applications, the different types of instruments, and the comparisons among gas chromatography and infrared spectrometer to help you in selecting the best instrument for your needs.


What is a Gas Chromatography and Infrared Spectrometer?
Understanding the fundamental functions of any instrument begins with its primary concepts and components. Each of Gas Chromatography and Infrared Spectroscopy provide unique insight into the structure and properties of different materials. They do this using different scientific methods. Let’s take a look at what makes each of them tick.
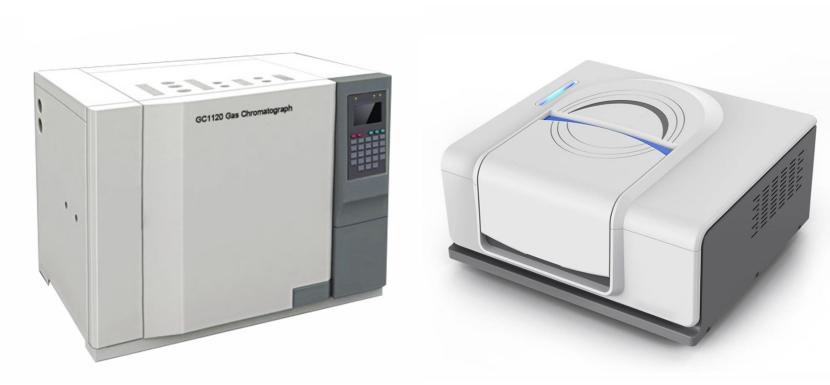
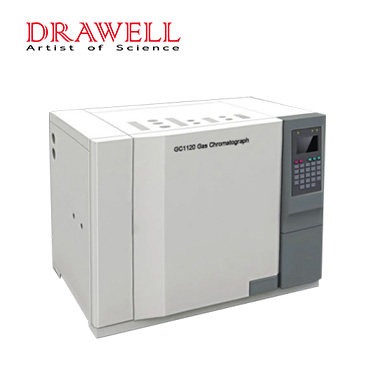
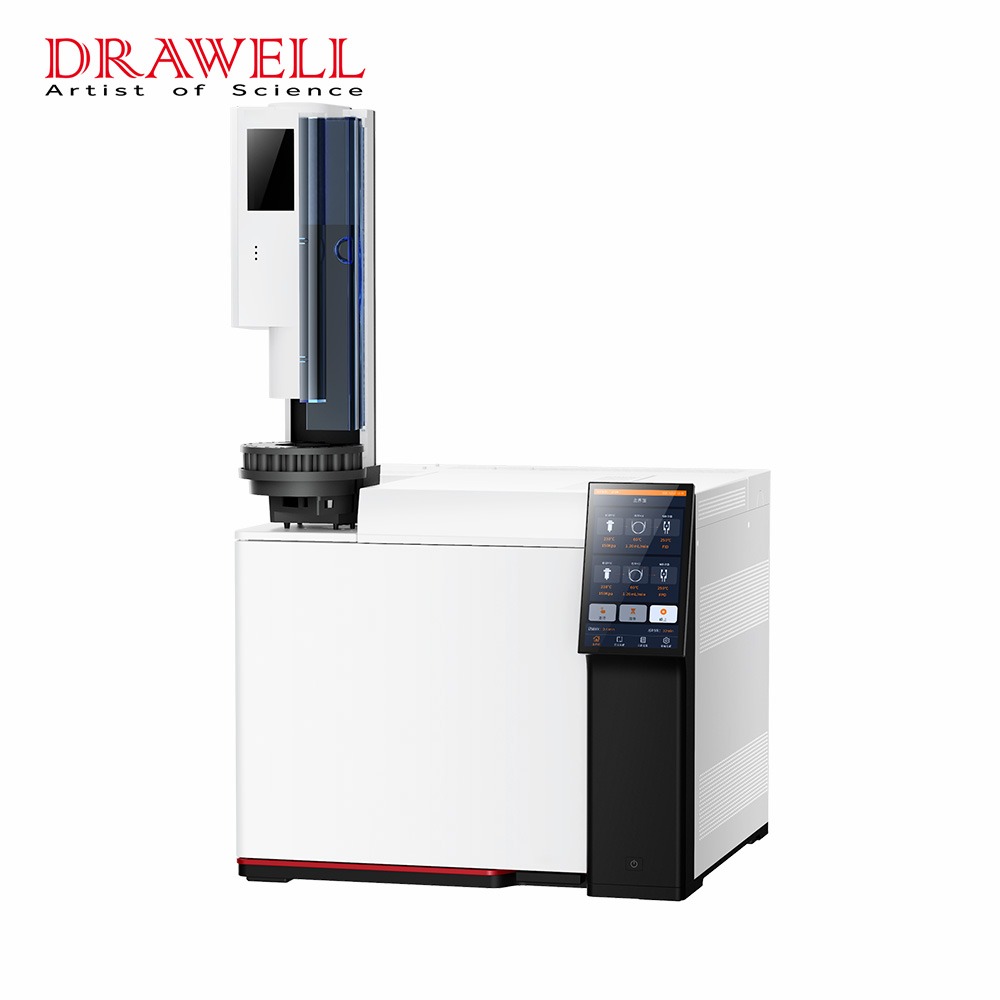
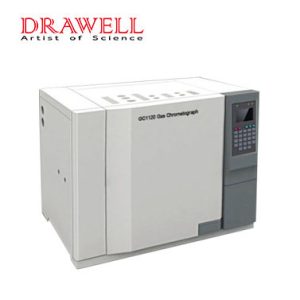
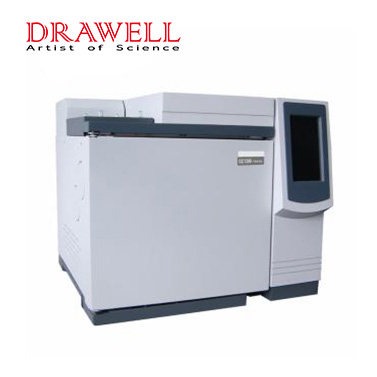
Gas Chromatography (GC): The Art of Separation
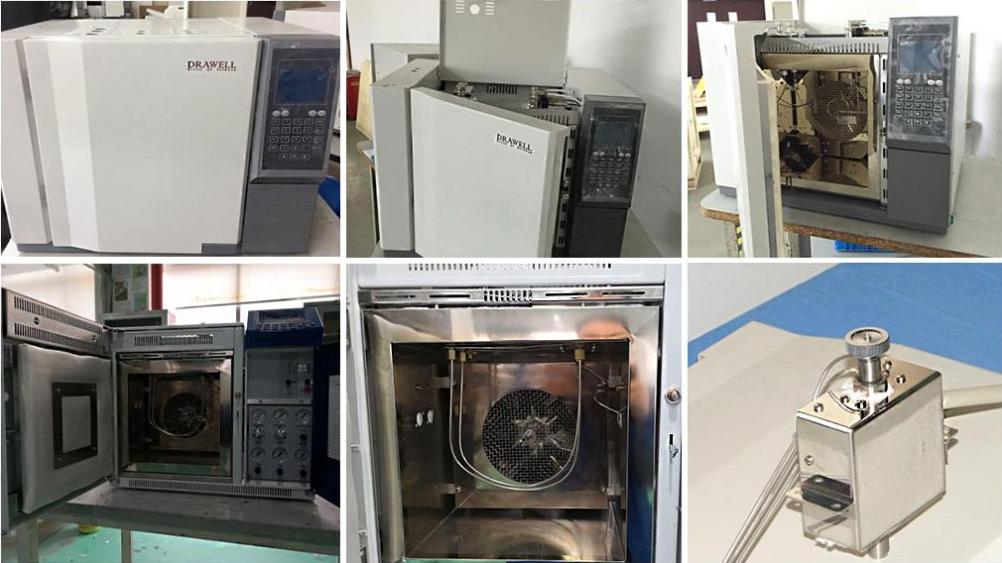
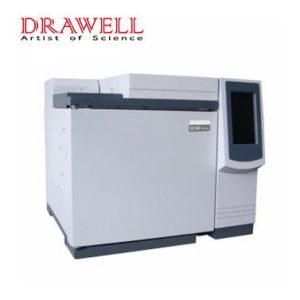
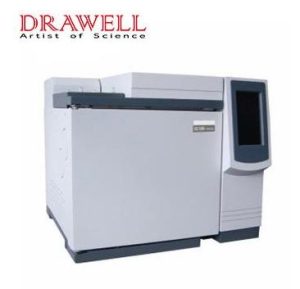
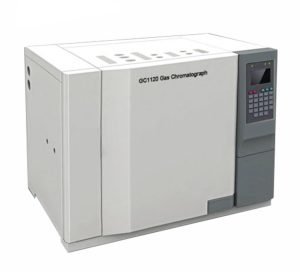
The gas chromatograph is an instrument for analysis designed to isolate and analyze compounds that are able to evaporate without decomposition. The basic concept behind it is the partitioning of components in a mixture of the stationary and moving gas phase. When the sample is moved through an column of compounds, they are able to interact with stationary phases in different ways creating a separation on the basis of properties such as boiling point and the polarity. The components that are separated then go to the detector, where they produce an electrical signal that is proportional to their amount.
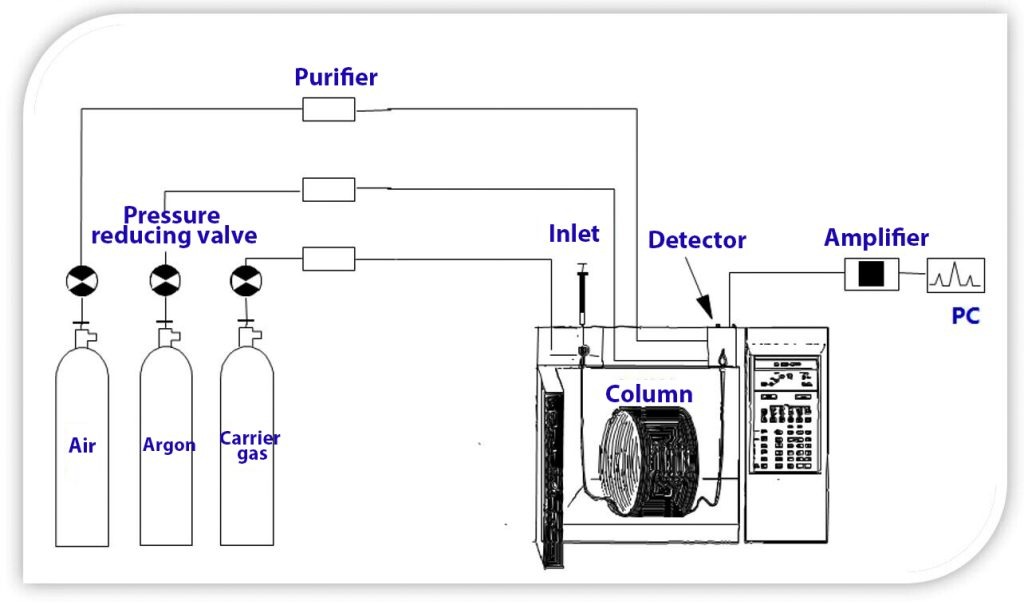
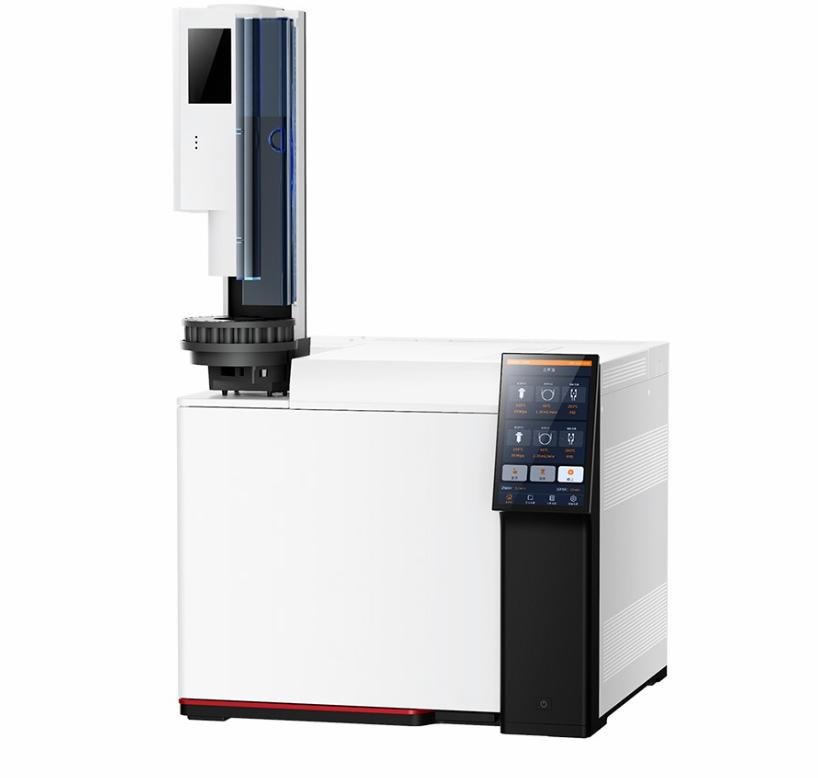
Key Components of a Gas Chromatography:
- Carrier Gas: A gas that is inert (e.g., Helium, Hydrogen, Nitrogen) that functions as a mobile phase, which sweeps the sample throughout the system.
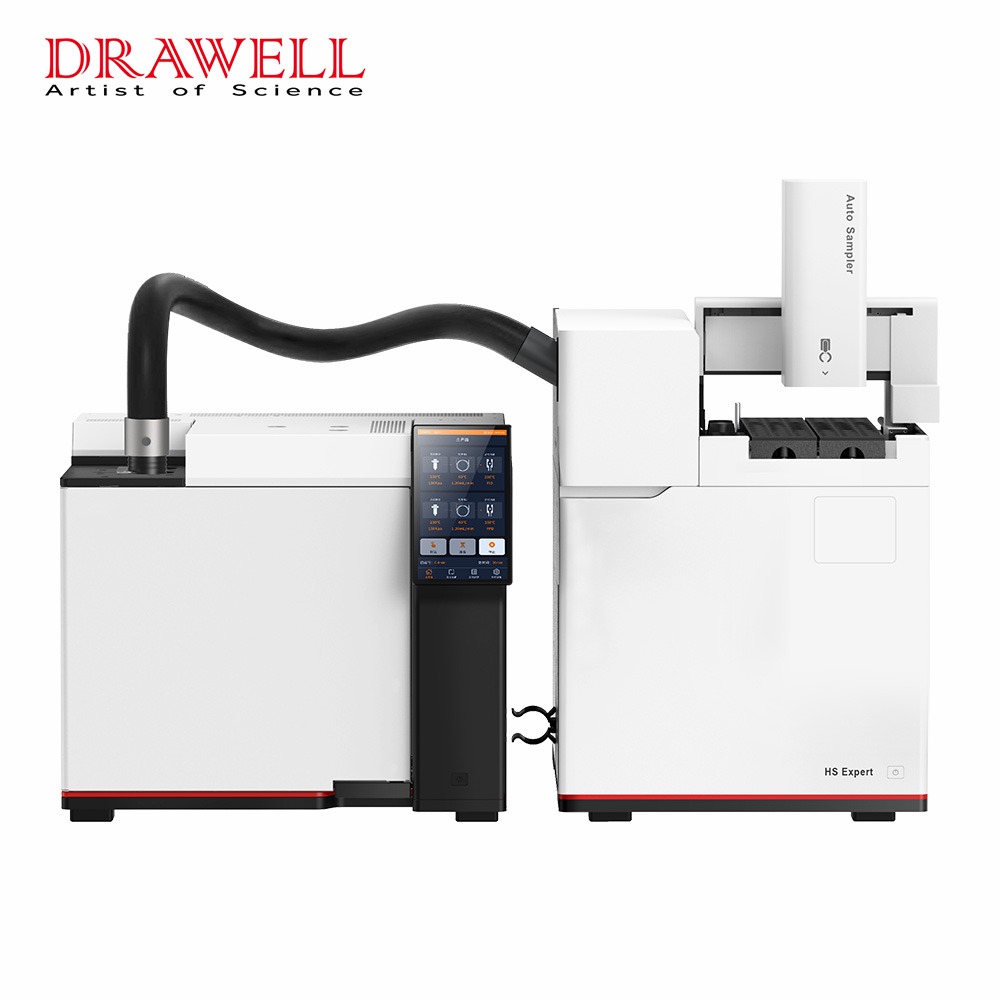
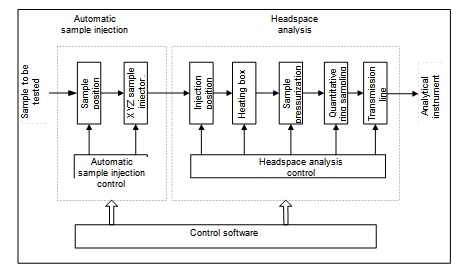
- Injector: The point at which the substance is introduced, which is typically heated to quickly vaporize liquid samples. The most common types are split or splitless injectors with different sample concentrations.
- Column: The core of separation. It’s a small tube (packed or capillary) filled by a stationary. Capillary columns are used more often to create high-resolution separations.
- Oven: Controls precisely temperatures of columns. It is typically programmed to increase temperature to maximize separation.
- Detector: Identifies and quantifyes the components that are separated after they have left the column. Common detectors include:
- Flame Ionization Detector (FID): Highly sensitive to organic compounds.
- Thermal Conductivity Detector (TCD): A universal detector that is less sensitive, but non-destructive.
- Mass Spectrometer (MS): It provides the most precise identification of compounds using pattern of fragmentation in molecular molecules (GC-MS).
- Data System: Captures and process signals from the detector to produce the chromatograms, and to quantify the analytes.
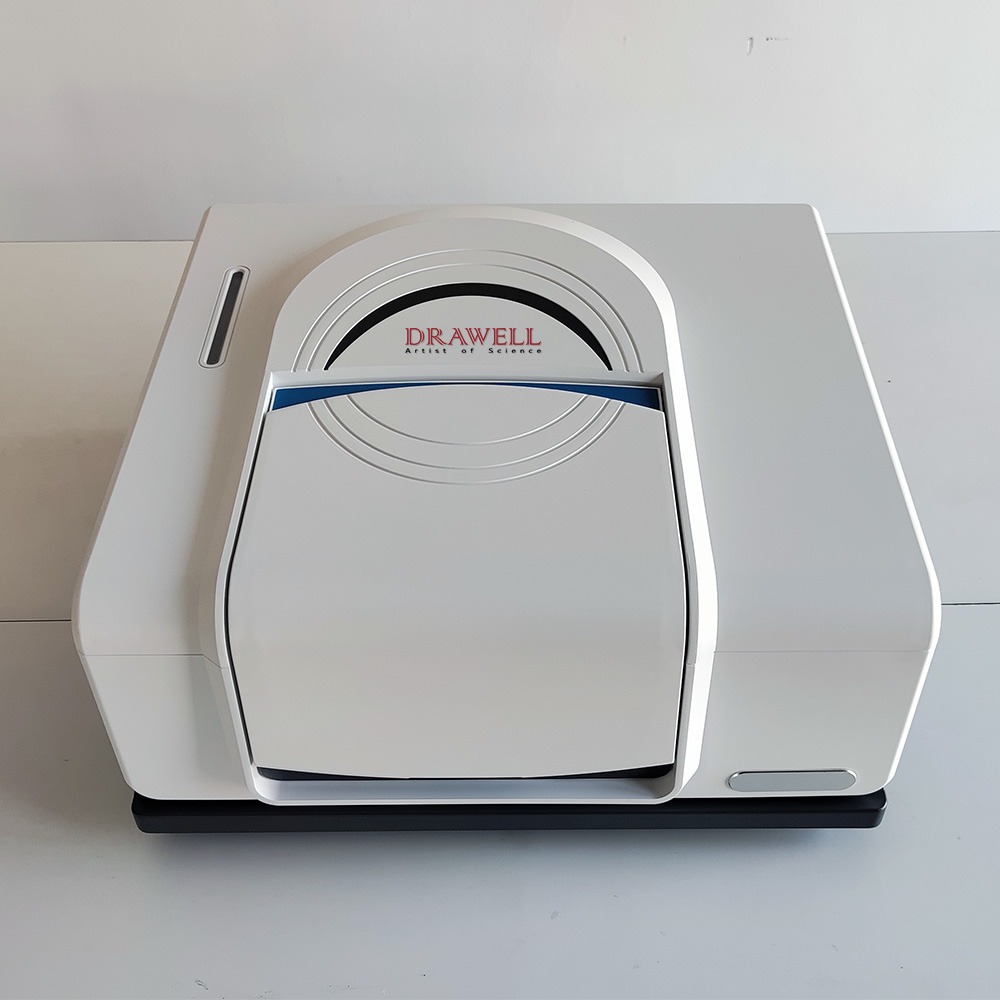
Infrared Spectrometer (IR): The Fingerprint of Molecules
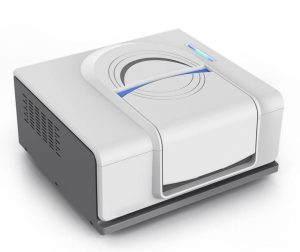
A infrared spectrometer particularly the latest FTIR equipment for Spectroscopy (Fourier Transform Infrared Spectrum) analyzes the interaction between infrared radiation and an object. The fundamental principle is that molecules absorb infrared radiation at specific frequencies which correspond to the vibrations that occur in the bonds between them. Every molecule is unique and has its own frequency of vibration that create a distinct “fingerprint” spectrum. Through the analysis of this Absorption patterns, you can determine the functional groups within a molecule, and in turn, identify the substance that is the compound. In contrast to GC, IR spectroscopy does not normally separate components but instead gives a complete biochemical fingerprint on the substance.
The key components for an Infrared Spectrometer (FTIR as example ):
- Infrared Source: Creates Infrared spectrum that is broadband (e.g. Glabar, or a ceramic component).
- Interferometer: The central component in an FTIR. It divides it’s IR beam, then sends it on two different paths (one fixed, the other moving) and then combine the two. This results in an interferogram which is a digital signal that carries all frequency information at once.
- Sample Compartment: This is where the sample is put to be analysed. The compartment can be used to accommodate various types of samples (solids liquids, gases, solids) with different accessories (e.g. ATR transmission cells diffuse reflectance).
- Detector: Measures the strength of the infrared radiation once it has been reflected or passed off the specimen. Common detectors include deuterated Triglycine Sulfate (DTGS) along with mercury Cadmium Telluride (MCT).
- Computer and Software: Performs the Fourier Transform on an interferogram to transform it into a standard IR spectrum (absorbance as opposed to. number of waves) and also provides instruments for spectral analysis as well as library matching.
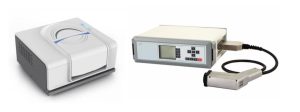
Near Infrared Spectrometer (NIR) is an instrument for infrared spectroscopy operating in the close-infrared portion within the electromagnetic spectrum. It detects overtone and combination spectrums of fundamental frequencies and provides data that are often connected to physical properties as well as the composition of bulk (e.g. moisture and protein content, as well as weight of fat). Although it is an IR spectrumrometer is in theory, NIR is different in its typical applications and the kind of information it offers.
Common Applications of each
Each GC and IR offer a wide range of applications in various industries. While GC excels in separating and quantifying specific parts, IR is invaluable for the identification of materials as well as quality control. understanding the molecular structure.
Typical Applications of Gas Chromatographs
| Industry/Field | Specific Use Case | What GC Can Analyze/Provide |
| Environmental | Air quality monitoring | Volatile Organic Compounds (VOCs), greenhouse gases |
| Water contaminant analysis | Pesticides, herbicides, industrial pollutants | |
| Soil remediation assessment | Hydrocarbons, solvents in contaminated soil | |
| Petrochemical | Natural gas analysis | Hydrocarbon composition (methane, ethane, propane) |
| Refined product quality control | Purity of fuels, presence of additives or impurities | |
| Process stream monitoring | Real-time composition of industrial gases/liquids | |
| Food & Beverage | Flavor and fragrance analysis | Aromatic compounds, esters, aldehydes in food products |
| Alcohol content in beverages | Ethanol quantification in beer, wine, spirits | |
| Pesticide residue detection | Trace levels of pesticides in fruits, vegetables | |
| Pharmaceutical | Purity testing of active pharmaceutical ingredients (APIs) | Impurities, residual solvents in drug substances |
| Drug stability studies | Degradation products over time | |
| Quality control of excipients | Presence of unwanted volatile compounds | |
| Forensics | Arson investigation | Identification of accelerants (e.g., gasoline) |
| Drug analysis | Identification and quantification of controlled substances | |
| Blood alcohol content (BAC) | Ethanol levels in biological samples |
Typical Applications of Infrared Spectrometers (including FTIR and NIR)
| Industry/Field | Specific Use Case | What IR Can Analyze/Provide |
| Polymers & Plastics | Material identification and verification | Polymer type (e.g., PE, PP, PVC), presence of additives |
| Contaminant identification | Non-conforming materials, foreign objects | |
| Quality control of raw materials | Consistent composition of incoming resins | |
| Pharmaceuticals | Raw material identification (RMID) | Verification of excipients and APIs |
| Counterfeit drug detection | Authenticity of drugs based on spectral fingerprint | |
| Process Analytical Technology (PAT) (often NIR) | Real-time monitoring of blending, tablet pressing | |
| Food & Agriculture | Adulteration detection (e.g., olive oil) | Presence of cheaper oils or unauthorized additives |
| Quality control of grains and dairy (often NIR) | Protein, fat, moisture content in milk, grains | |
| Sugar content in fruits (NIR) | Ripeness and sweetness assessment | |
| Chemicals | Functional group analysis of organic compounds | Identification of hydroxyl, carbonyl, amine groups |
| Reaction monitoring | Tracking consumption of reactants, formation of products | |
| Quality control of industrial chemicals | Purity and consistency of manufactured chemicals | |
| Forensics & Art | Fiber identification in crime scenes | Classification of textile fibers |
| Paint chip analysis | Identification of paint layers and binders | |
| Pigment identification in artwork | Determining historical authenticity, conservation |
Gas Chromatography vs. Infrared Spectroscopy
Although they both GC as well as IR are vital in labs that conduct analysis Their fundamental differences determine their capabilities for different tasks. We will compare their most important characteristics and then discuss their benefits and drawbacks.
Key Feature Differences:
| Feature | Gas Chromatography (GC) | Infrared Spectroscopy (IR) (FTIR/NIR) |
| Type of Analysis | Separative; determines and quantifies each component | Non-separative; recognizes functional groups as well as the general molecular structure |
| Primary Function | Separation, identification, and accurate quantification of volatile/semi-volatile compounds | Identification of materials, Qualitative Functional group analysis, certain quantifiable (less more sensitive than GC) |
| Sample Type | Semi-volatile and volatile compounds should be stable thermally, or derivatizable. | Gases, liquids, solids with no thermal or volatility stability requirements |
| Sample Preparation | Often requires specific preparation (dissolution, extraction, derivatization); micro-liter volumes | Minimum or no the ability to conduct a direct test is available for a variety of samples and often requires accessories such as ATR |
| Destructive? | It can cause damage (e.g. FID) Non-destructive using TCD or MS in certain applications. | The sample is usually non-destructive and can be found in its entirety |
| Information Provided | The retention time (for identification) (for identification), peak area/height (for the quantification) mass spectrum (with MS) | Absorption bands (specific to functional groups) distinctive spectrum fingerprint |
| Sensitivity (Trace) | High ability to detect levels of parts per trillion (ppb) as well as parts per trillion (ppt) levels, and especially using MS coupling | Moderate to low; generally portions of a million (ppm) for the major components. It can be difficult to analyze trace elements |
| Speed | It can range between minutes and hours per sample, based on the degree of the complexity of separation as well as length of column | Rapid; usually just a few seconds to minutes for each scan (FTIR) fast, almost instantaneous for certain NIR applications. |
| Cost | The range varies from mid-range for the basic GC-FID up to the high end for super-advanced GC-MS devices (tens in the hundreds to thousands of dollars) | Variable from benchtop models that are accessible (tens of thousands of dollars) to high-end research-grade FTIRs and process the NIR system (tens of thousands up to 100 thousand USD) |
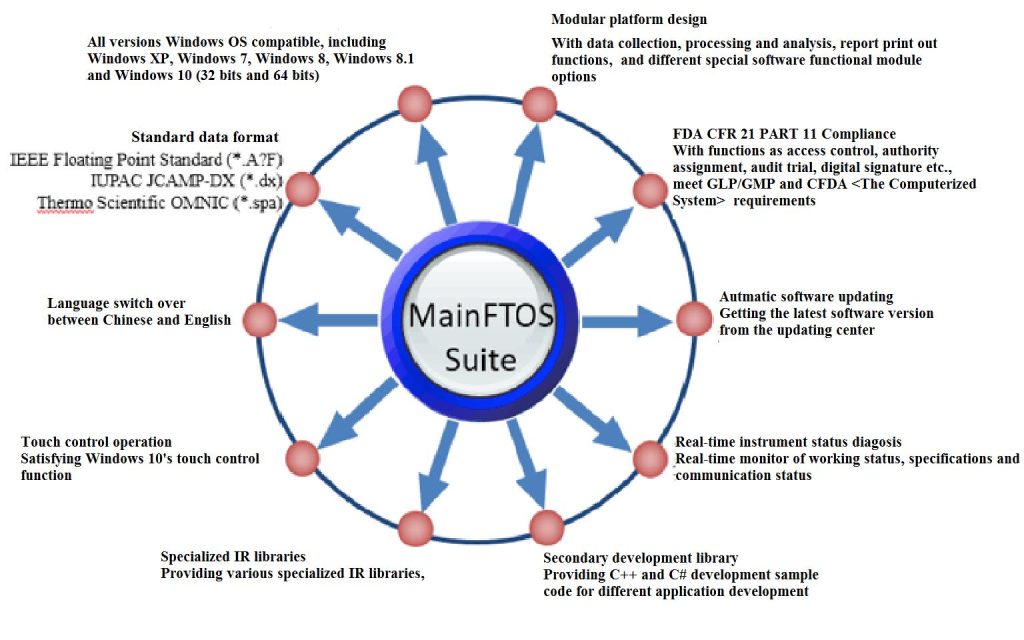
DW-FTIR-530Pro-FT-IR-Main-FTOS-Suite-Software-Workstation
Advantages and Limitations of Each Method
Each analytical method has each one of its advantages and disadvantages. This is a comparison of the two in a more concise table:
| Feature | Gas Chromatography (GC) | Infrared Spectroscopy (IR) (FTIR/NIR) |
| Advantages | Excellent Separation Power: Resolves complex mixtures into individual components, even isomers. | Non-Destructive Analysis: Sample remains intact and can be used for further tests. |
| High Sensitivity & Quantitation: Capable of detecting and quantifying trace levels of analytes with high precision and accuracy. | Minimal Sample Preparation: Many samples can be analyzed directly (solids, liquids, powders) with little or no preparation. | |
| Definitive Identification (with MS): Coupling with Mass Spectrometry (GC-MS) provides robust compound identification. | Rapid Analysis: Provides results in seconds to minutes, ideal for high-throughput screening and quality control. | |
| Versatility: Wide range of detectors available for specific applications, allowing for tailored analysis. | Provides Structural Information: Identifies functional groups and gives a unique molecular fingerprint, aiding in unknown identification. | |
| Established & Mature Technology: Well-understood principles and extensive libraries/databases available. | Versatile Sampling Techniques: Various accessories (ATR, transmission, diffuse reflectance) accommodate diverse sample types. | |
| Cost-Effective for Qualitative Analysis: Benchtop FTIR units can be a more affordable entry point for material identification. | / | |
| Limitations | Requires Volatility: Cannot analyze non-volatile, ionic, or high molecular weight compounds directly. | Less Quantitative Sensitivity: Generally less sensitive for precise quantification of trace components compared to GC. |
| Thermal Stability Required: Samples must not decompose at the high temperatures used for vaporization and separation. | Difficulty with Complex Mixtures: Overlapping peaks in mixtures can make interpretation challenging without chemometrics. | |
| Sample Preparation Intensive: Often requires complex and time-consuming sample preparation steps. | No Separation Capability: Provides a bulk analysis; does not separate individual components within a mixture. | |
| Method Development: Can require significant time and expertise to develop and optimize methods for new samples. | Water Interference: Water strongly absorbs IR radiation, which can obscure other peaks in aqueous samples. | |
| Longer Analysis Times: Separations can take considerable time, especially for complex samples or high-resolution needs. | Limited to Organic and Some Inorganic Compounds: Only molecules with IR-active vibrations can be detected. | |
| Spectral Interpretation Expertise: Requires some knowledge of chemistry and spectroscopy for accurate interpretation, though library matching helps. | / |
Choose Between GC and IR
The choice between a gas-chromatograph and an infrared spectrumrometer isn’t about either being intrinsically “better” than the other instead, it’s about coordinating the capabilities of the instrument to answer your particular analytical need. In many cases, the best option could involve using both.
When to Choose GC and IR
| When to Choose Gas Chromatography (GC) | When to Choose Infrared Spectroscopy (IR) |
| Separating complex Mixtures It is necessary to identify and quantify the individual elements from a mix that contains volatile substances. | Fast Material Identification require rapid, non-destructive identification of the material. |
| Trace Analysis: The high sensitiveness is crucial to determine and quantify extremely low levels of particular chemicals. | Functional Group Analysis need to be aware of the various kinds of chemical bonds and functional groups that are present in a particular sample. |
| The Definitive Identifier: you need an accurate identification of volatile substances, particularly when they are paired with MS. | Quality Control and Verification Ideal for routine inspection of the material, release of product or for counterfeit detection. |
| Volatile/Semi-Volatile Compounds: Your samples are compounds that can be vaporized without decomposition. | Non-Destructive Analyses: You must to study a sample without altering it or eating it. |
| / | Very little sample preparation: Many samples can be analysed in a single step with minimal or no preparation. |
| / | Process Monitoring (NIR) is a real-time monitoring online of manufacturing properties in bulk. |
When Both are Better:
In many complicated analytical scenarios using both GC and IR can provide the most complete and thorough understanding of the sample than either method could offer on its own. This approach combines the strengths of both methods.
Unknown contaminants Imagine that manufacturing facilities discover an unidentified substance within their manufacturing line. Initial IR scan can quickly pinpoint the type of the compound (e.g. the silicone or plasticizer) by their functional categories. This is a vital first hint. If the substance can be identified as volatile, then it may be analyzed and extracted using GC-MS to pinpoint the chemical compound that is in question and the quantity. IR gives”what class” and “what class,” while GC-MS gives an answer to the “what exactly and how much.”
Analyzing Polymer Additive Researchers want to know the composition of a novel polymer blend. This includes the type of polymer and any additional stabilizers or plasticizers. FTIR is able to discern the primary backbone of the polymer (e.g. PVC, polyvinylchloride PVC). However the specific plasticizers which are generally smaller in molecular weight and are semi-volatile, could be difficult to discern out of the polymer matrix using only IR. In this case, GC can be utilized following extraction to isolate and measure the various plasticizers, thereby providing a full overview of the mix’s composition.
Quality Control that meets multiple needs in the field of nutrition, a business may use NIR for quick non-destructive, on-line quality monitoring of the incoming ingredients (e.g. the checking of the content of protein and moisture in flour). If the batch is flagged as not meeting the specifications or not in compliance with the specifications, it is possible that a GC analysis may be carried out on a subsample in order to determine the presence of certain pollutants or spoilage compounds that are outside the reach of NIR. This method of layering provides general and precise quality assurance.
Through combining the separation capabilities and precision in quantitative measurements of GC along with the speedy non-destructive capability of material identification of IR, researchers are able to tackle a broader range of challenging issues with greater certainty and effectiveness.
The decision to choose between a gas-chromatograph or an infrared spectrometer is based on your needs for analysis such as sample type and budget. Both are vital tools and when used together, they will provide you with a wealth of information about the chemical analysis.
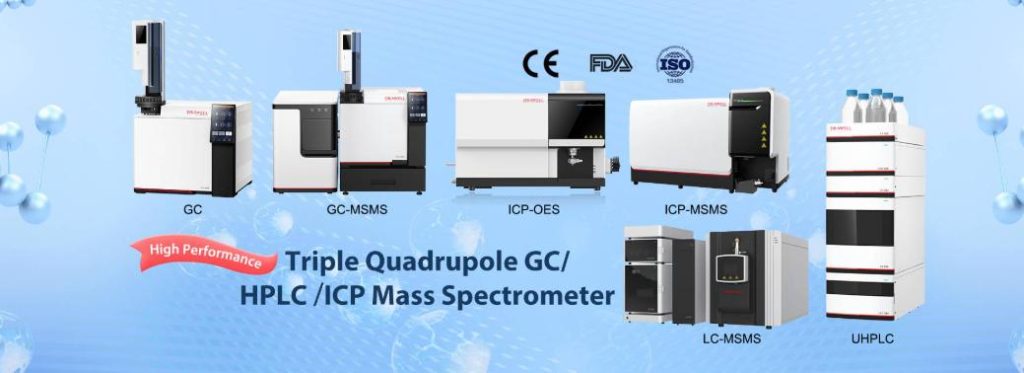
For the most advanced industry-leading GC as well as IR instruments put your trust in Drawell. Explore our extensive selection of accurate and reliable instrumentation for analytical use to fulfill your laboratory’s needs.
Related Products Recommendation
Get Quote Here!
Latest Posts
What Next?
For more information, or to arrange an equipment demonstration, please visit our dedicated Product Homepage or contact one of our Product Managers.