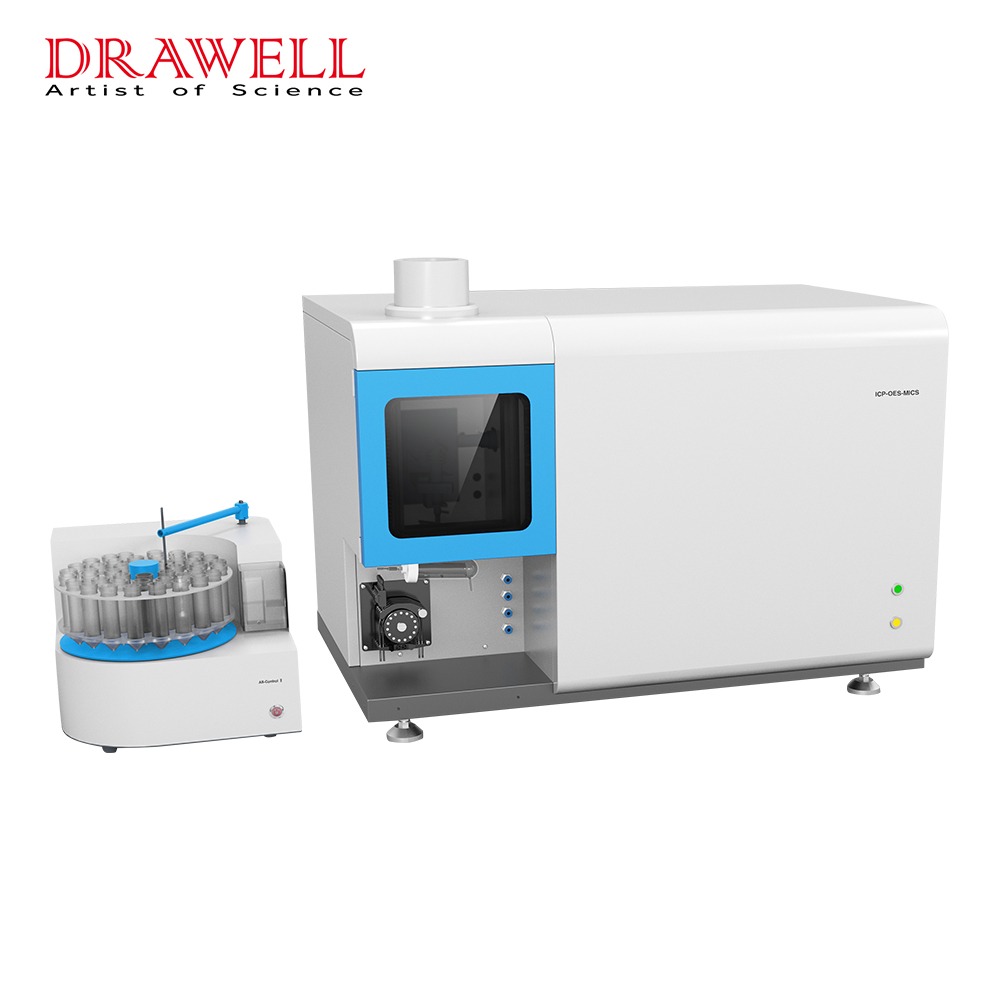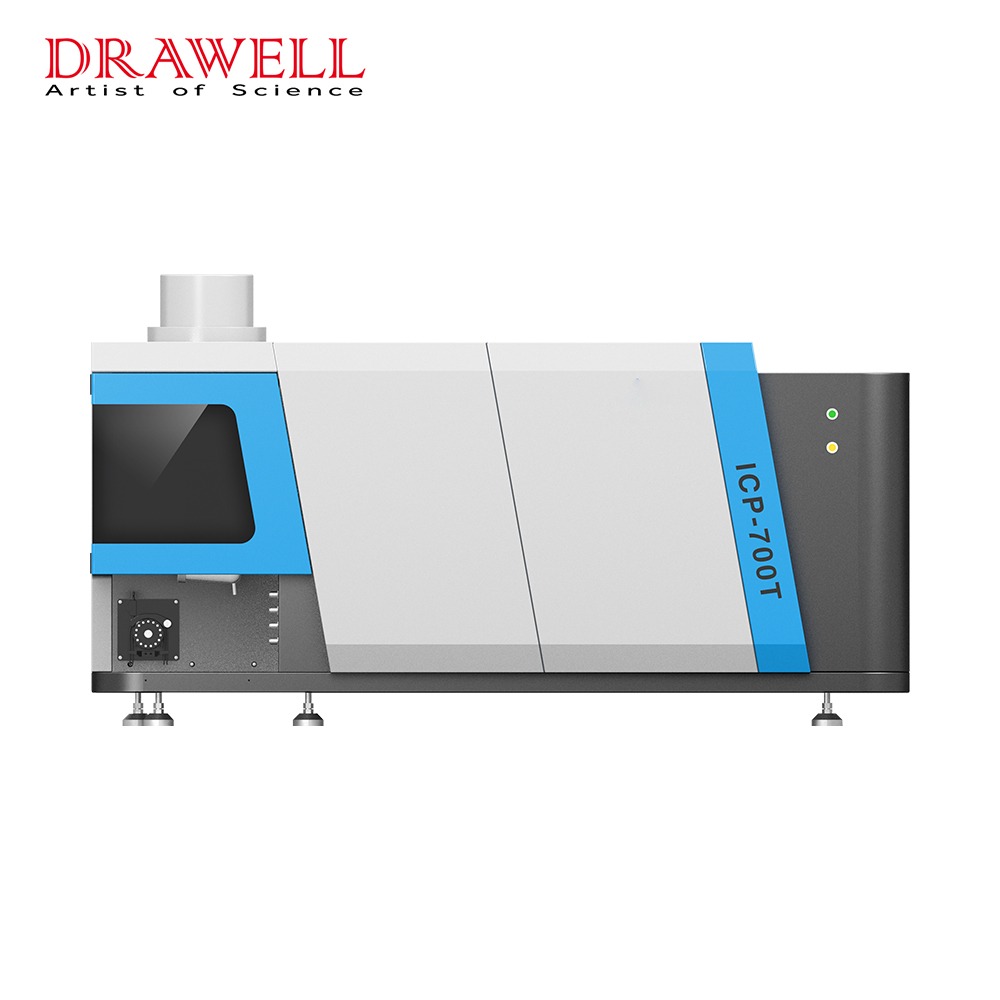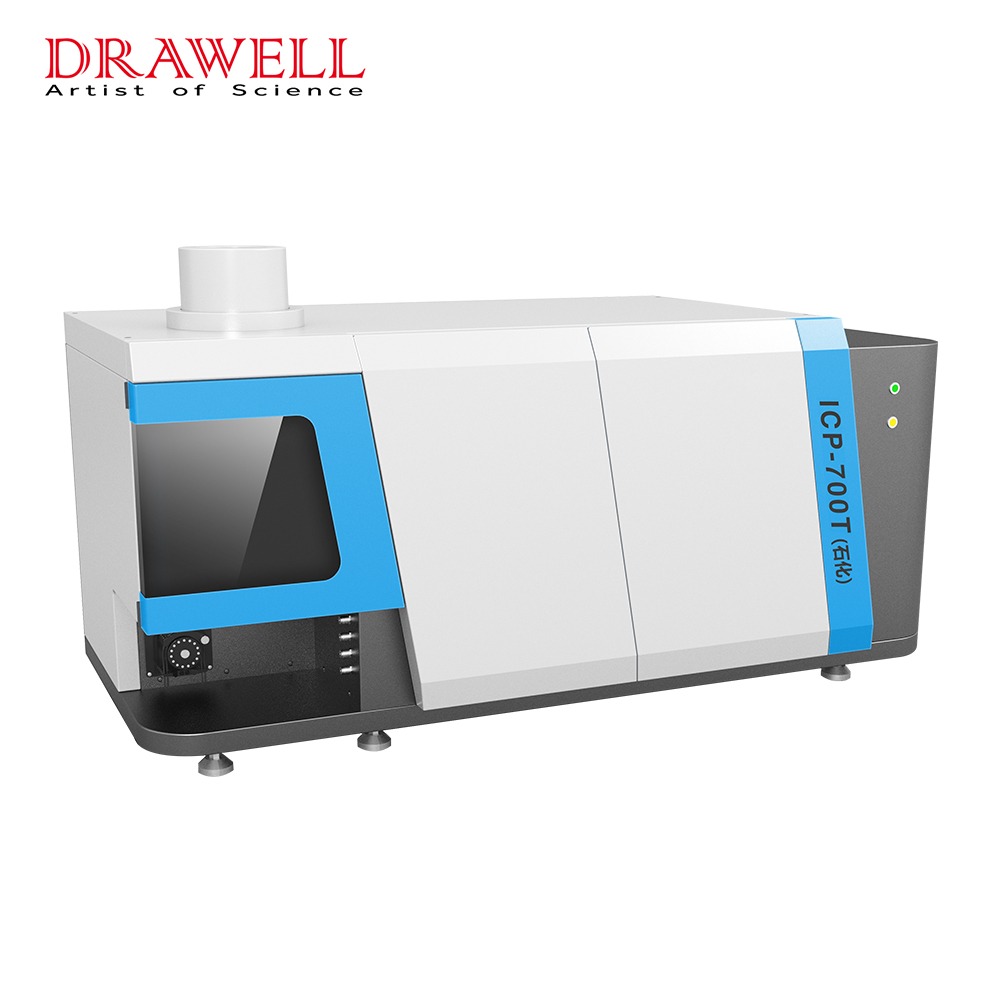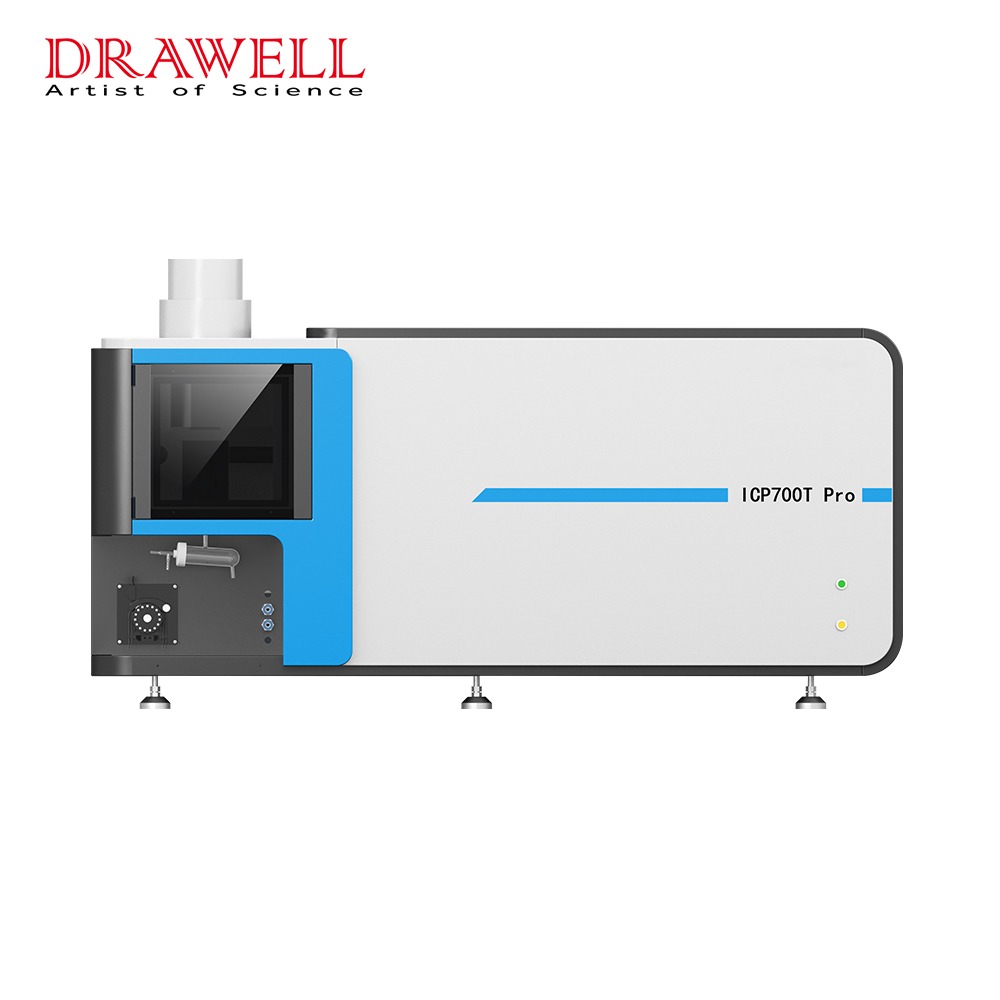

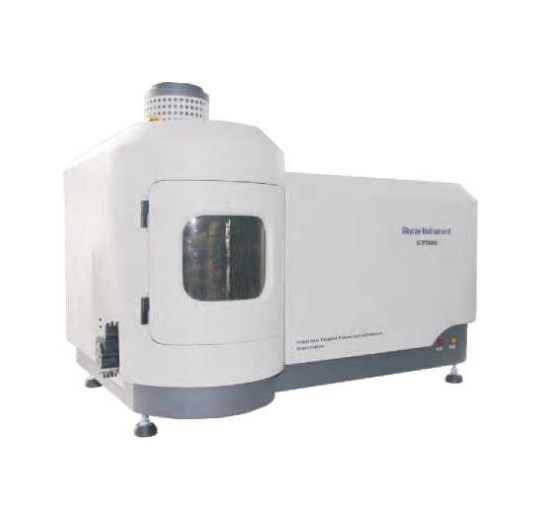
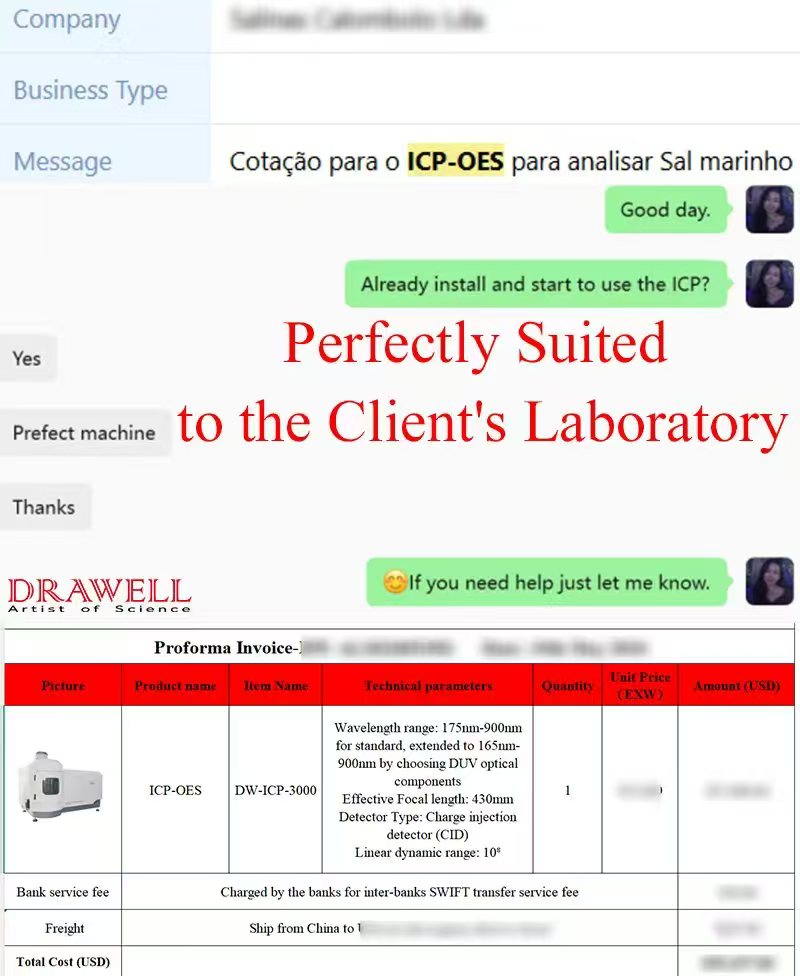
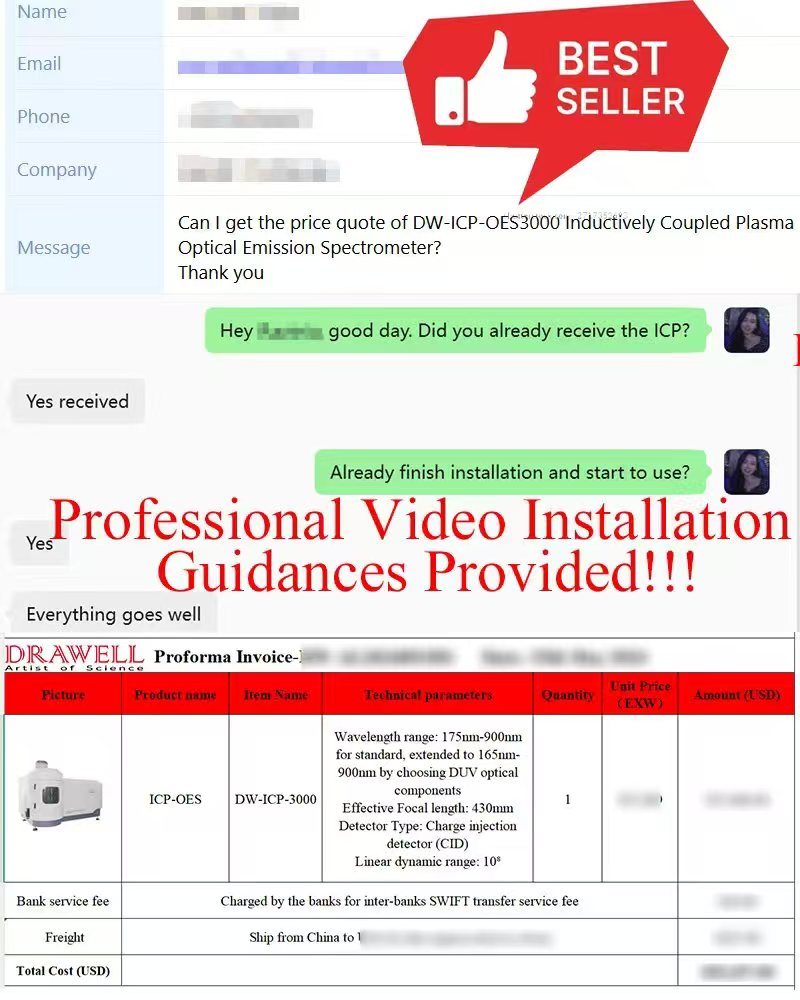
DW-ICP-3000 Inductively Coupled Plasma Emission Spectrometer
DW-ICP-3000 inductively coupled plasma emission spectrometer, simultaneous full spectrum direct-reading spectrometer, is used for trace elemental analysis in diverse samples (soluble in hydrochloric acid, nitric acid, hydrofluoric acid, etc). It is currently widely applied in various fields of rare earth, geological, metallurgical, chemical, environmental, clinical medicine, petroleum, semiconductor, food, biological samples, criminal science and agricultural research etc..
- WL range: 175nm-900nm for standard, extended to 165nm-900nm by choosing DUV optical components
- Detector Type: CID
- Liquid content: 0.01 ppm- several thousands ppm; Solid content: 0.001%— 70%
- Detection limit (pg/L): 1 ppb-10 ppb for most elements
Advantages of DW-ICP-3000 Inductively Coupled Plasma Emission Spectrometer
- Full Automation Design: Computer-controlled operation except for the power switch, ensuring reliable, safe, and convenient use.
- Automatic Gas Flow Control: Carrier, plasma, and auxiliary gases are precisely controlled by mass flow controllers (MFCs) for stable sample introduction and plasma performance.
- Precise Wavelength Positioning: Intelligent automatic wavelength calibration eliminates additional peak calibration, saving solution and analysis time while ensuring accuracy.
- Fast Automatic Power Matching: Automatically optimizes RF output power to improve ignition efficiency, energy utilization, and instrument stability.
- Ultra-Fast Analysis: Supports flexible integration times, full-exposure intensity acquisition, and selected-line readout in less than 2 ms.
- Powerful Analysis Software: Provides qualitative, semi-quantitative, and quantitative analysis, instrument diagnostics, intelligent optimization, full-spectrum research, offline reprocessing, background correction, and interference removal.
- Flexible Sample Introduction System: Compatible with various nebulizers and spray chambers, including optional high-solids and HF-resistant nebulizers.
- Stable Solid-State RF Generator: Compact solid-state RF power system delivers stable output, reliable ignition, and enhanced operational safety.
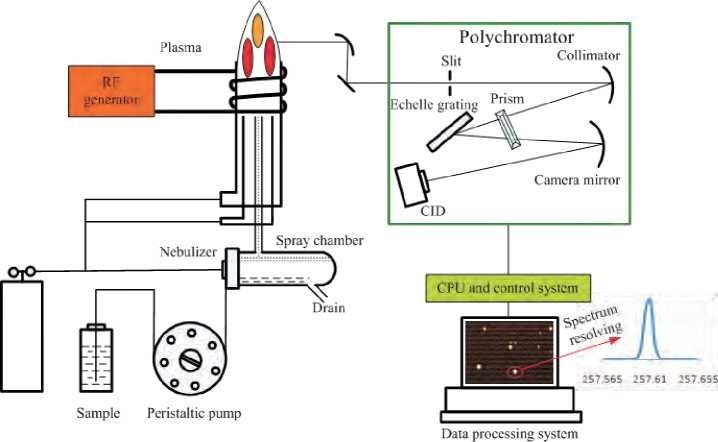
- High-Performance Optical System: Echelle-prism cross-dispersion optics provide high light throughput, excellent resolution, low stray light, and long-term stability. Efficient N₂ purging supports deep-UV analysis of elements such as P, S, and As.
- Advanced CID Detector: Large-area megapixel CID detector captures the full 165–900 nm spectrum. Non-destructive readout improves weak-signal SNR, measurement precision, and analysis speed.
Software Advantages
ICP-3000 Software:
ICP3000 operating software can control all functions of the instrument, including plasma ignition, gas flow control (Figure 1), and security monitoring (Figure 2), etc…
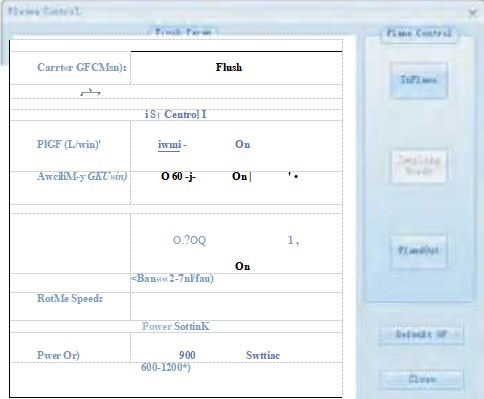 Figure 1
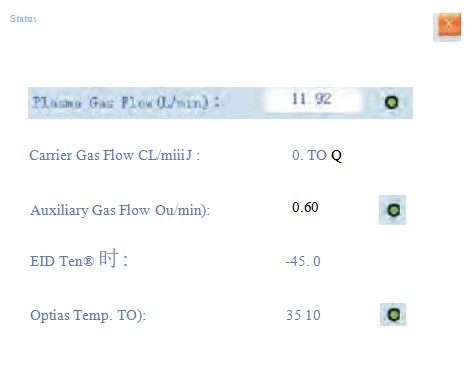 Figure 2
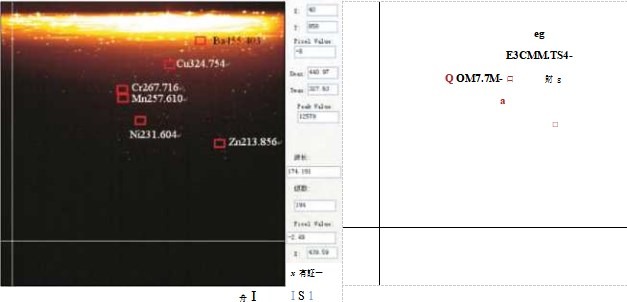 Figure 3
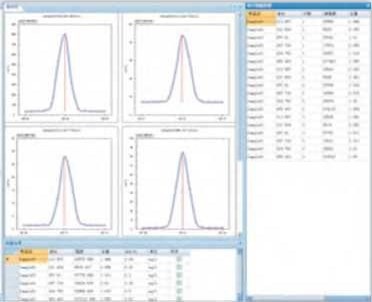 Figure 4
Daily Analysis Software:
specifying the individual pixel or pixel subarray region for quantitative analysis (Figure 3 & 4).
Methods & data set separation management, strong off-line re-processing function, auto or manual real-time background correction for option(Figure 5)
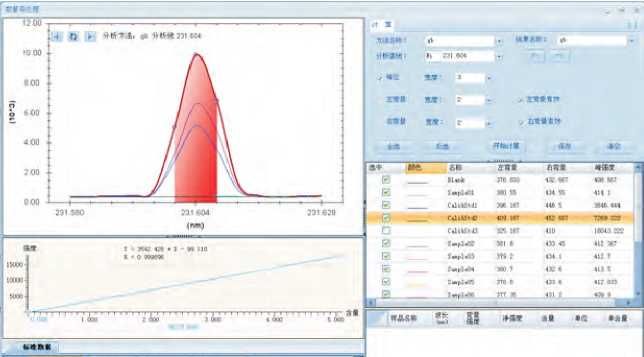 Figure 5
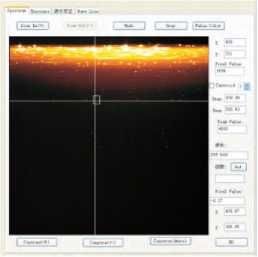 Figure 6
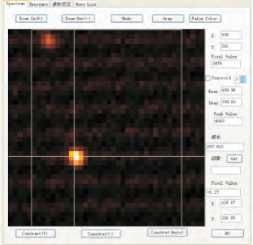 Figure 7
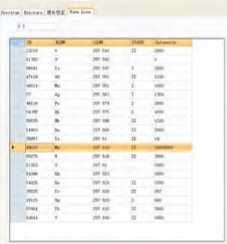 Figure 8
Fullframe-spectrum mode:
directly showing the whole emission spectra, directly acquiring the emission intensity, auto-peak identification, interactive spectral library, qualitative&semi-quantitative analysis of the elements (Figures 6, 7 and 8):
- Autosampler mode:the autosampler is provided as per required.
- Calibration type:multi-point calibration curve, of which the number of the standard points is not limited.
- Curve fitting display: linear, auto-adjust the range.
- Data report:export the report based on sample names, method names, elements, intensity, concentration, mean, standard deviation, relative standard deviation, time, date, etc., and generate the analysis report automatically.
- Optional format:analysis data can be stored in user-specified data format, e. g. Excel, Word, PDF, image, etc..
Applications of DW-ICP-3000 Inductively Coupled Plasma Emission Spectrometer
1. Silicon Industrial
Test magnetic materials
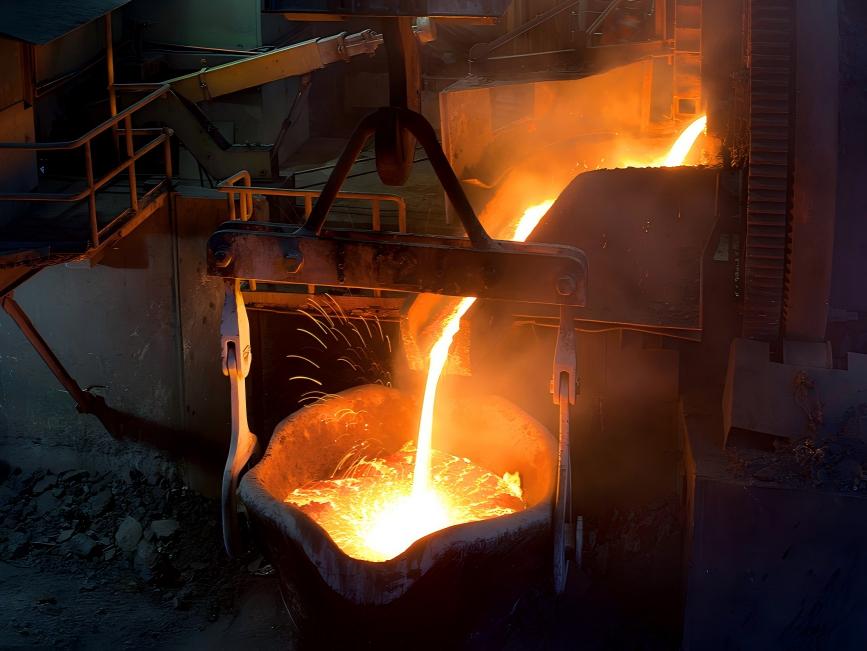
2. Metallurgical
Analyze As, Bi, Pb, Sb, Sn and other impurity elements, which effect greatly the metallic materials quality Water analysis: analyze 8 heavy metal elements
3. Geological, mineral
Analyze Ca, Mg, Na, Fe, Cu, Mn, Zn, Co, M, Au, Ag and other elements in the rock samples
4. Petrochemical and Industrial
Analyze over 30 elements in crude oil , mainly Fe, Na, Mg, Ni, V, Ca, Pb, Mo, Mn , Cr, Co, Ba, As, etc.
5. Pharmaceutical, health, agricultural and environmental and Food safety


FAQ
Optional Autosampler
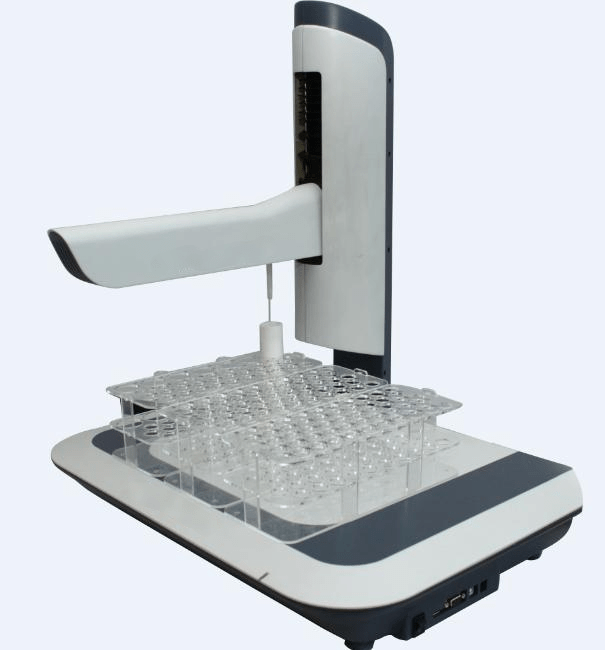
AS100 Autosampler
Technical Specifications:
- Sample platform: 57cups
- Cups Volume: 50ml
- Load Cup Volume: 1L
- Power Supply: 220V±10%、50/60HZ±1HZ
Customer Service of DW-ICP-3000 Inductively Coupled Plasma Emission Spectrometer
Why Choose Us?
“Multiple suppliers” have always been an issue in the procurement process. Drawell as a one-stop laboratory equipment and scientific instruments supplier, can perfectly solve this problem. In addition to manufacturing our own equipment, we also represent other laboratory equipment. Our product lines are rich and diverse at competitive prices. Provide one-stop service to customers.
User Training – Training by Drawell skilled engineers about installation, debug tests, technical services, etc. It can happen in our factory in China, or at the site in the customers’ country. Cost depends on where and when the training happens.
To discuss the problem and get it resolved, online chats, real-time video calls, and remote guidance. For the after-sales stage, our online technical guidance is free and ready forever.
1 year free official warranty, including repairing quality-damaged parts, and offering replacements of selected parts (shipping cost is extra). 5% of the product price is charged for extending the warranty before the end of the official warranty.
2.jpg)