
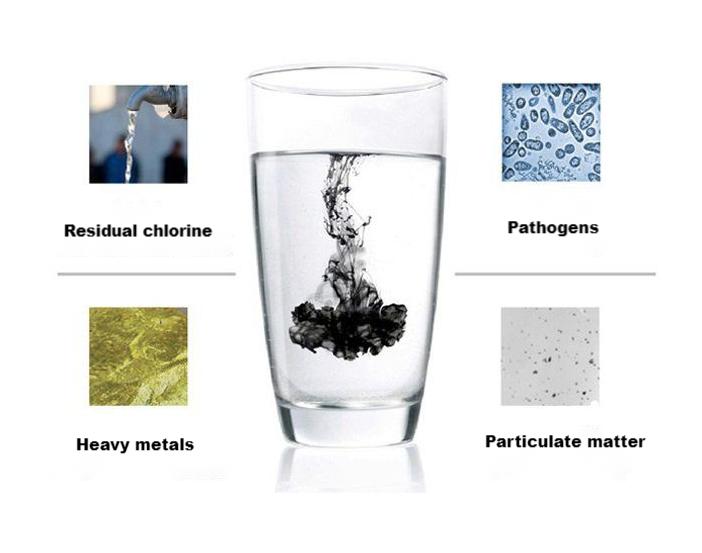
Water analysis is a critical aspect of environmental monitoring, quality control, and public health. Ensuring the purity and safety of water resources requires accurate and reliable analytical techniques. UV-Vis spectrophotometry offers a robust and versatile approach to water analysis, providing valuable insights into the chemical composition and quality of water sources. The UV-Vis spectrophotometer combination of simplicity, sensitivity, and broad applicability makes it an indispensable tool for various stakeholders involved in water management and environmental protection.
Working Principle and Advantages
The reliability of UV-Vis spectrophotometer stems from its well-established working and detection principles, coupled with several inherent advantages that make it particularly suitable for water analysis.
Working Principle
A UV-Vis spectrophotometer operates by passing ultraviolet (UV) or visible light through a water sample. The instrument measures the intensity of light absorbed by the sample at specific wavelengths. Different substances absorb light differently, creating unique absorption spectra that can be used to identify and quantify the presence of particular compounds.
The detection relies on the Beer-Lambert law, which states that the absorbance of light is directly proportional to the concentration of the absorbing substance and the path length through which the light travels. By analyzing the absorption spectrum, the spectrophotometer can detect contaminants such as nitrates, phosphates, heavy metals, and organic pollutants.
Advantages of Use
Several advantages contribute to the reliability of UV-Vis spectrophotometer in water analysis:
- Simplicity and Ease of Operation: UV-Vis spectrophotometers are relatively straightforward to operate, requiring minimal sample preparation in many cases. This simplicity reduces the potential for human error and makes it a practical tool for routine analysis.
- Sensitivity and Accuracy: The technique offers good sensitivity for a wide range of analytes, allowing for the detection of even trace amounts of contaminants. With proper calibration and adherence to standard procedures, highly accurate and reproducible results can be obtained.
- Non-Destructive Analysis: In most applications, the water sample remains unchanged after analysis, allowing for further testing using other techniques if needed.
- Speed and Efficiency: UV-Vis analysis is generally a rapid technique, allowing for the quick processing of multiple samples, which is crucial for timely water quality monitoring.
- Cost-Effectiveness: Compared to more complex analytical techniques, UV-Vis spectrophotometers are relatively affordable to purchase and maintain, making them accessible to a wide range of laboratories and organizations.
- Versatility: The technique can be applied to the analysis of a diverse array of parameters in water, including organic pollutants, inorganic ions, disinfection byproducts, and color.
- Established Methodologies: Numerous standardized methods and protocols based on UV-Vis spectrophotometry are available for various water quality parameters, ensuring consistency and comparability of results across different laboratories.
The reliability of UV-Vis spectrophotometer in water analysis is firmly rooted in its fundamental principles and the numerous practical advantages it offers. Its simplicity, sensitivity, versatility, and cost-effectiveness make it a dependable choice for a wide spectrum of water quality assessments.
Key Application Areas in Water Analysis
UV-Vis spectrophotometer serves as a versatile and reliable tool for a multitude of applications in water quality testing. Its ability to detect and quantify various substances based on their unique light absorption characteristics across the ultraviolet and visible spectrum makes it invaluable for environmental monitoring, industrial wastewater analysis, and drinking water safety assessments. The technology is applied across different stages of water management, from source water characterization to treated water monitoring. It allows for the identification and quantification of a wide array of organic and inorganic contaminants, as well as physical parameters indicative of water quality. The following table provides a more detailed breakdown of specific applications, detectable substances, and their corresponding approximate wavelengths of maximum absorbance.
| Application Area | Substance Detected | Approximate Wavelength (nm) | Notes |
| Nutrient Analysis | Nitrate (NO3− ) | ~220 | Strong absorbance in the UV region. |
| Nitrite (NO2− ) | ~350, ~540 (after diazotization) | Direct UV absorbance and colorimetric determination after reaction. | |
| Phosphate (PO43− ) | ~690 (as phosphomolybdate blue) | Colorimetric determination after reaction with molybdate reagents. | |
| Organic Pollutant Monitoring | Phenols | ~270 | Characteristic UV absorption. Shift in wavelength with pH changes. |
| Aromatic Hydrocarbons (e.g., Benzene, Toluene) | ~254, ~260, ~267 | Strong UV absorbance, specific peaks vary with the compound. | |
| Pesticides (various) | Varies | Many pesticides exhibit characteristic UV-Vis absorption; specific wavelengths depend on the compound. | |
| Disinfection Byproduct (DBP) Monitoring | Trihalomethanes (THMs) (e.g., Chloroform) | ~200-260 (indirect after reaction) | Often analyzed indirectly after derivatization or using specific methods coupled with UV-Vis. |
| Haloacetic Acids (HAAs) | ~200-240 (indirect after reaction) | Typically analyzed indirectly after derivatization and chromatographic separation. | |
| Metal Ion Analysis | Iron (Fe2+,Fe3+) | ~510 (as thiocyanate complex), ~480 (with phenanthroline) | Colorimetric determination after reaction with specific complexing agents. |
| Manganese (Mn2+) | ~525 (as permanganate after oxidation) | Colorimetric determination after oxidation to permanganate. | |
| Chromium (Cr(VI)) | ~370, ~540 (with diphenylcarbazide) | Direct UV absorbance and colorimetric determination after reaction. | |
| Physical Parameter Assessment | Color (Chromaticity) | 400-700 | Measurement of absorbance across the visible spectrum to quantify color intensity and hue. |
| Turbidity (Suspended Solids) | Varies | Measurement of light scattering at specific wavelengths (not direct absorbance). | |
| Aggregate Parameters | Nitrate-Nitrite (as Nitrogen) | ~220, ~540 | Often measured together using reduction methods followed by nitrite determination. |
| Total Organic Carbon (TOC) | ~254 (surrogate after oxidation) | UV absorbance of oxidation products can be correlated with TOC. |
The technique’s capacity to provide both qualitative identification (through wavelength maxima) and quantitative determination (through absorbance intensity) makes it an indispensable tool for researchers, environmental regulators, and water treatment professionals in their efforts to monitor, manage, and protect our vital water resources. The continuous development of new reagents and methodologies further expands the scope and sensitivity of UV-Vis spectrophotometry in addressing emerging challenges in water quality analysis.
Parameters to Focus on When Purchasing and Their Impact
Selecting the right UV-Vis spectrophotometer is crucial for ensuring reliable and accurate results in water analysis. Several key parameters should be carefully considered during the purchasing process, as they directly impact the instrument’s performance and suitability for specific applications.
Parameters to Focus On and Their Impact:
- Wavelength Range
The range of wavelengths that the spectrophotometer can measure is critical. For comprehensive water analysis, an instrument with a broad wavelength range, typically from the UV (190-400 nm) to the visible (400-800 nm) regions, is preferred to accommodate various analytes.
A limited wavelength range may restrict the types of analyses that can be performed.
- Spectral Bandwidth
This parameter defines the range of wavelengths that are allowed to pass through the sample at a given nominal wavelength. A narrower bandwidth provides higher spectral resolution, which is essential for distinguishing between closely spaced absorption peaks and for accurate quantitative analysis.
A wider bandwidth can lead to spectral overlap and reduced accuracy, especially for complex mixtures.
- Photometric Accuracy and Precision
Accuracy refers to how close the measured absorbance values are to the true values, while precision refers to the reproducibility of the measurements. High photometric accuracy and precision are fundamental for reliable quantitative analysis.
Poor accuracy leads to incorrect concentration estimations, while poor precision results in inconsistent data.
- Stray Light
Stray light is unwanted light that reaches the detector without passing through the sample. High levels of stray light can cause deviations from Beer-Lambert Law, particularly at high absorbance values.
Stray light limits the upper detection limit and can lead to inaccurate results for concentrated samples.
- Baseline Stability
A stable baseline is essential for accurate absorbance measurements. Fluctuations in the baseline can introduce noise and errors in the data.
An unstable baseline reduces the sensitivity and reliability of the measurements.
- Sample Handling System
Consider the types of samples to be analyzed (e.g., liquids, solids) and the required throughput. Options include single-cell holders, multi-cell carousels, and flow cells for continuous monitoring.
An inappropriate sample handling system can limit the types of analyses and reduce efficiency.
- Software and Data Processing Capabilities
User-friendly software with features for data acquisition, processing, analysis, and reporting is crucial for efficient operation and data interpretation.
Inadequate software can hinder data analysis and increase the risk of errors.
- Calibration and Validation Features
The instrument should allow for easy calibration using standard solutions to ensure accuracy. Features for performance validation and quality control are also important for maintaining reliability.
Lack of proper calibration and validation can compromise the accuracy and traceability of results.
Careful consideration of these purchasing parameters is essential for selecting a UV-Vis spectrophotometer that meets the specific needs of water analysis applications.
Choosing an instrument with appropriate specifications ensures the generation of reliable and accurate data. If you need any recommends for UV-Vis spectrophotometer, please feel free to contact us.
Related Products Recommendation
What Next?
For more information, or to arrange an equipment demonstration, please visit our dedicated Product Homepage or contact one of our Product Managers.